Log analysis in Wevo iPaaS
The logs screen allows you to analyze errors and monitor the data transiting through your flow.
This video (provided in Portuguese) walks you through the logs screen:
Log filters
The log filter can be used to make looking up a record or a series of records faster. The filters available include these:

-
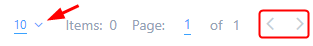
Number of Records Shown: Click the option highlighted in the screenshot below to define how many logs should be shown in a page. The default is 10, but you can change that to 20, 50, or 100. To browse between the pages, use the arrows (highlighted to the right).
-
Flow Version: If your flows have more than one version, you can choose to see the logs pertaining to a specific one of them. Click All Versions to see the versions available.
-
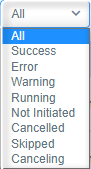
Filter by Status: You can also see only the logs with a certain status:
-
Success: Only runs that finished without errors.
-
Error: Runs that encountered some kind of error.
-
Warning: Runs that concluded with warnings.
-
Running: Runs that are still in progress.
-
Not Initiated: This is the status that runs that should have occurred at a scheduled time, but something prevented that from happening.
-
Cancelled: Runs that were manually cancelled.
-
Skipped: Runs that were skipped over.
-
Cancelling: Runs that were manually cancelled, and the cancellation is still in progress.
-
-
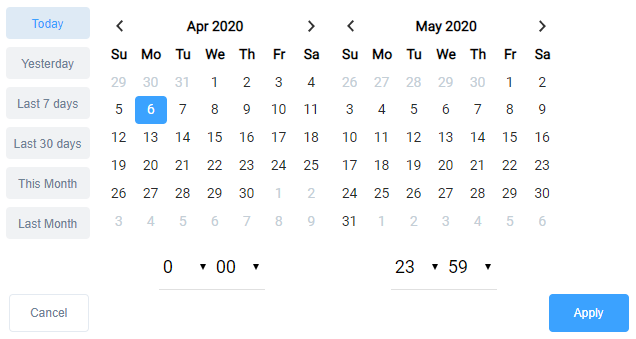
Calendar: You can also filter the list of logs to see the ones that took place inside a specified period of time.
Log list

The logs are shown organized in columns. They indicate:
-
Status: The status of each log. They are described in the section above.
-
Date: When each log was created.
-
Start: What time the process was initiated.
-
Finish: What time the run was completed.
-
Execution Time: How long a run took, in seconds.
-
Processed: How much data was processed.
-
Runtime Version: The runtime version configured in your flow.
-
Version: This item refers to the flow version created in the version tab. See Flow versioning to learn more.
Log message
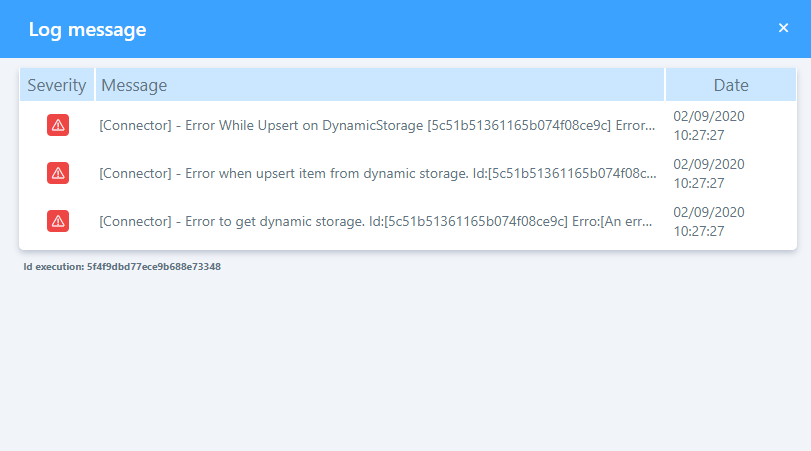
By clicking the magnifying glass, you can see the messages associated with a specific log, as shown below:
-
Severity: This column has three possible states: a blue icon is shown when there's additional information, a yellow icon is shown when there is a warning, and a red icon is shown when there's an error.
-
Message: The message generated by the system based on the severity status. Click on it to see its entirety.
-
Date: The time and date when the log was generated.
Actions
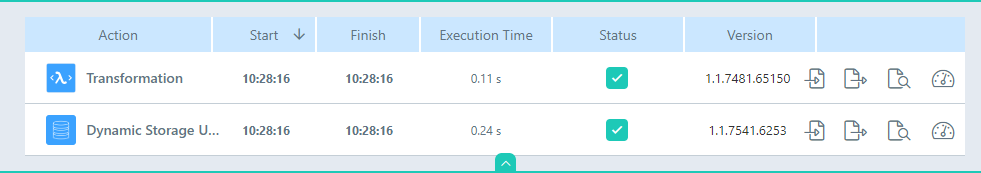
When you click on one of the logs, you see a table similar to the one described above in the Log list section, but with an additional column: Action. This allows you to see what happened during the execution of each one of your flow's steps.
Analyze the inputs and outputs
To get a better understanding of what occurred during each one of the flow's steps, use the Input, Output, and Show Metrics icons, shown in the screenshot below, to see details of the movement of information.

-
Input: See the data that was received by each individual action.
-
Output: See the data that each action sent.
-
Show Metrics: This option breaks down what was done with each piece of information, whether they were read, altered, inserted, ignored, processed, downloaded or uploaded.
Input and output visualization options
When you click the Input or Output icons described above, you can see the data in different formats. The following options are shown:
- Visualize json
- Visualize table
- Visualize tree
- Show metadata
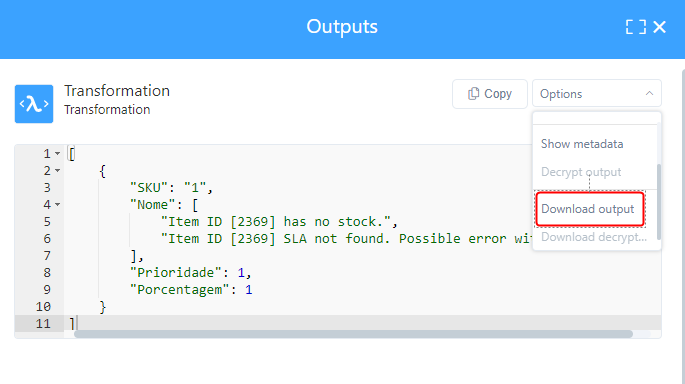
Download the inputs/outputs
Click Options, then Download Output to download a .txt file containing the input or output data.
Log cryptography
You can also encrypt your output logs, see Log cryptography to learn more.
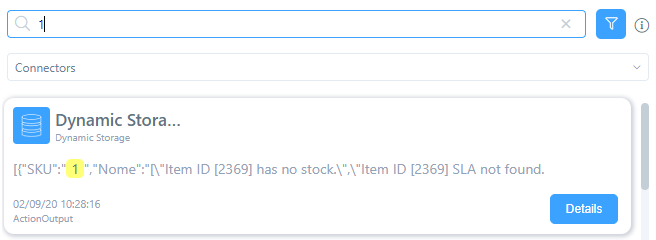
Search
The search field can make it easier to locate a specific record. Insert any piece of data you're interested in finding (maybe a piece of code, or a word), and the platform will show you corresponding results. You can also select a specific connector to see only its logs. By clicking on Details, the information related to that particular log is shown. You can also filter your searches through Messages or through Log ID.