How to use the org chart widget in Jitterbit App Builder
Overview
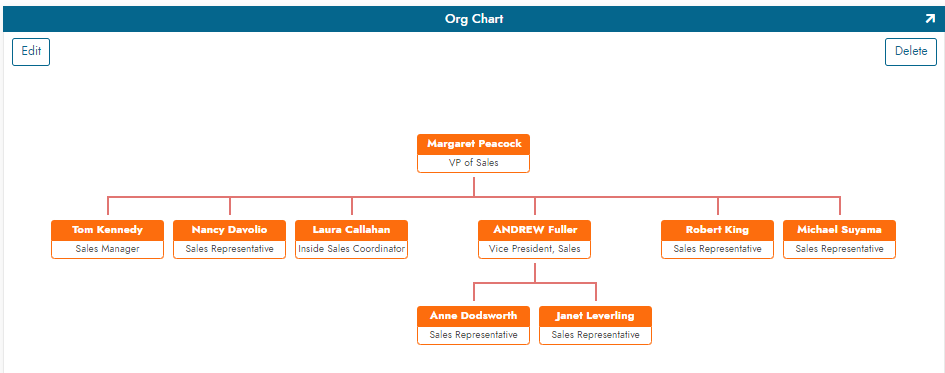
The Org Chart widget renders hierarchical data, such as a reporting structure, as an interactive org chart on an App Builder page. The widget itself doesn't store any data: it calls a REST endpoint you expose (its jsonURL parameter) using an API key you generate, and renders whatever hierarchical JSON that endpoint returns.
Note
The Org Chart widget is available from the Widget download library.
The steps are:
-
Configure App Builder to be an API
Expose your org chart data as a REST endpoint the widget can call. -
Configure the org chart widget
Upload the widget, point it at your endpoint, and optionally customize its colors. -
Add the widget to an App Builder page
Embed the configured widget on a page, and supply the API key and URL it needs to run.
Configure App Builder to be an API
Before the widget can display anything, it needs a REST endpoint to call for data. To expose your org chart data through App Builder's REST API, follow the steps in Publish a Jitterbit App Builder app as a REST API endpoint:
-
Set up a security provider API key. For example, name it
OrgChartAPI. -
Configure an endpoint for your application. For example, use
chartsas the Endpoint value. -
Publish a resource for the table or object that holds your org chart data. For example, use
rosteras the resource's Endpoint value.When configuring the resource's fields, uncheck Include By Default for any columns not required for the org chart, and set GET Max Limit if needed, depending on the number of levels in your org chart.
-
Configure API keys for users for anyone who needs to access this data.
Configure the org chart widget
With your data exposed as a REST endpoint, install the widget itself and point it at that endpoint:
-
Upload the Org Chart widget to App Builder, to a collection the app you want to work with has access to.
-
Configure the parameters required by the widget, as enumerated on the Widget Download Library. Values entered are case sensitive. The
jsonURLvalue follows the REST API URI convention: combine your instance's REST API base URL with your application's Endpoint and the resource's Endpoint. For example,https://localhost/rest/v1/charts/roster.
Optionally, you can customize the org chart's colors by editing the CSS files packaged inside the widget's .zip file:
-
Label and border colors are set in
\Css\vinyl.orgchart.css, using hex values. -
Line and hover colors are set in
\Css\jquery.orgchart.css, using RGB values.
Add the widget to an App Builder page
Finally, embed the configured widget on a page, and make sure it has access to the API key and jsonURL value it needs to call your endpoint:
-
Navigate to the app page where you want to display the widget, and add a Single Row panel that always returns one record. For example, use the Param or User table.
-
Add a Text control to the panel, then add the org chart widget to that control.
-
If the org chart doesn't display, the panel's data source may not be supplying the widget's required values. Optionally:
-
Configure the data source the panel is using to have a record that returns the API key and the
jsonURLused by the org chart. -
Add two hidden Text controls to the panel, mapped to the API key and the
jsonURL. You can store these values in a Param table, for example.
-