Jitterbit private agent troubleshooting
This page provides troubleshooting guidance for common problems encountered when installing, running, or managing a Jitterbit private agent. Start with the diagnostic steps below, then find your specific error in the relevant section. Contact Jitterbit support for issues not listed here.
For a unified reference covering integration, automation, API management, EDI, and app development issues in one place, see the Harmony troubleshooting guide.
All troubleshooting entries on this page
-
- Agent offline or unreachable
- Agent showing different versions or IP addresses
- Agent shows Unknown or Stopped after reusing an agent group across operating systems
- Agent sync failure: Project changes not applying
- Operations delayed or queued after project deployment
- Agent showing as incapable
- Transformation fails: "Failed to find file in the local file store"
-
Installation and upgrade errors
- Error 1720 or 1722 on Windows installation
- PostgreSQL service removed after failed upgrade on Windows
- Agent services fail to start after restarting Windows following an upgrade
- TFA prevents 64-bit Windows agent installation
- Recover a failed Windows installation
- Linux non-root installation fails
- JDBC driver: "No suitable driver found"
- Connector not downloaded to agent
- Agent installation cannot register through a corporate proxy
-
Performance and resource issues
- Java heap space:
OutOfMemoryError - Disk space and log accumulation
- Agent service restart loop
- Operations timing out or ignoring timeout settings
- Agent throughput unchanged after increasing
max.concurrent.requests - XML transformation slowdown after upgrading to agent 11.45 or later
- JVM mini-dump files fill the agent's disk
- Java heap space:
-
- Certificate handshake failure (TLS)
- Salesforce sandbox connection fails with certificate mismatch
- FTP: Data connection timed out
- SSH: SFTP connection fails due to incorrect key file path
- SFTP SSH settings missing or in the wrong
jitterbit.confsection - SFTP authentication failure to a specific server (cURL cipher mismatch)
- HTTPS proxy: Basic authentication through proxy tunnel fails
- Private agents in restricted networks: Outbound-only connectivity
- Custom API returns 504 but the operation log shows success
- IPv6 issue on Windows
-
- Apache Server error: No installed
ConfigArgs - Apache/Tomcat:
APPARENT DEADLOCK - Apache crashes unexpectedly under concurrent load
- Cleanup service cannot remove locked log files on Windows
- Linux: Agent services fail to start after a reboot ("postmaster.pid does not exist")
- Linux: Antivirus removes PgBouncer, agent fails to authenticate to the bundled database
- Security scans flag
log4j-over-slf4j.jaras a Log4j 1.x vulnerability
- Apache Server error: No installed
Diagnostic steps
These steps are the recommended starting point for most private agent issues.
Check the agent status
Review the agent's current status in the Management Console under Agents > Private, then use it to narrow down the problem. For the complete status definitions and how they transition, see Agent status.
| Status | What it means for troubleshooting |
|---|---|
| Running | The agent is healthy, so the problem is likely elsewhere: the project, a connection, or the target endpoint. Start with the operation logs. |
| Starting | Normally transient. If an agent stays in this state, it cannot finish synchronizing or reach Harmony. See Agent offline or unreachable and Agent sync failure: Project changes not applying. |
| Stopping | The agent is finishing a drain stop. If it stays in this state, a running operation is not completing. |
| Stopped | The agent is registered but not running. Start the services. See Agent offline or unreachable. |
| Unknown | There was no heartbeat within the last 5 minutes, which usually points to a connectivity or service problem. See Agent offline or unreachable. |
| Unregistered | Setup is not complete. If a new agent never leaves this state, finish registration. |
Check the agent log files
The agent log files are the primary source of diagnostic information. Check the following file for errors related to connectivity, service health, and operation failures:
- Windows:
C:\Program Files\Jitterbit Agent\log\jitterbit-agent.log - Linux:
/opt/jitterbit/log/jitterbit-agent.log
For a full list of available log files, see Agent logs.
Use the Agent Support Tools
The Agent Support Tools provide diagnostic commands that run directly on the agent host:
connection-check: Verifies connectivity from the agent to the Harmony cloud, Apache, and Tomcat services.service-status: Shows the running state of all agent services (Apache, Tomcat, PostgreSQL, PgBouncer, VerboseLogShipper).generate-report: Creates a diagnostic HTML report and a ZIP file of all agent log files, useful when escalating to Jitterbit support. On Linux agents, the report currently omits PostgreSQL data; Windows agents are not affected.
To access the tools:
cd /opt/jitterbit/AgentSupportTools
./run.sh
cd "C:\Program Files\Jitterbit Agent\AgentSupportTools"
.\run.bat
Restart the agent
Many transient issues (stale routing caches, pool exhaustion, lock conditions) resolve with a service restart:
- Windows: Start or restart the agent
- Linux: Start or restart the agent
Caution
Restarting the agent terminates any operations currently in progress. Use a drain stop first if you need running operations to complete before the restart.
Agent status and connectivity
Agent offline or unreachable
- Symptom: The Private tab of the Management Console Agents page shows the agent as Unknown or Stopped, or Studio displays an
Agent Not Running or Unreachableerror. -
Possible causes:
- The Jitterbit services are not running.
- The services are running but the agent host cannot reach the Harmony cloud.
- A corporate proxy is preventing the agent from connecting.
-
Resolution:
-
If the Jitterbit services are not running, start them:
- Windows: See Start a Windows agent.
- Linux: See Start a Linux agent.
If the service fails to start, check the following for error messages:
- Windows:
C:\Program Files (x86)\Jitterbit Agent\logand the Windows Event Viewer Application log. - Linux:
/opt/jitterbit/log.
The account running Jitterbit services requires local administrator rights on Windows and full access to the Jitterbit installation directory.
-
If the services are running but cannot reach the Harmony cloud, verify the following:
- Internet connectivity from the agent host is working.
- The agent log (
jitterbit-agent.log) does not contain error messages about cloud connectivity. - The agent can reach the Harmony portal on port 443.
-
If the agent connects through a corporate proxy, verify the proxy is configured correctly for the agent, including the NTLM domain if the proxy uses NTLM authentication. See Proxy server for Jitterbit private agents. The proxy server's denied log is useful for diagnosing what the proxy is blocking.
-
If the agent's services are healthy on the host (
jitterbit statusshows all services running) but the agent repeatedly flips to Unknown, or cycles between Running, Unknown, and Stopped, the agent's connection or process is likely being interrupted between heartbeats. Check the following possible causes:- A network device (firewall, NAT gateway, or cloud-VM idle timeout) may be closing the agent's outbound connection between heartbeats. Try reducing the agent's heartbeat interval (
agent.heart.beat.interval). For cloud-hosted agents, see Azure VM: Lost connections and WebSocket/I/O errors, which also applies to other restricted networks such as AWS. - The agent may have crashed under memory pressure. Check for
OutOfMemoryErrororhs_err_pidcrash dump files. See Java heap space:OutOfMemoryError. - If the agents were recently migrated to a new operating system while reusing an agent group that previously hosted agents on the old OS, the reused group may be the cause. See Agent shows Unknown or Stopped after reusing an agent group across operating systems.
- A network device (firewall, NAT gateway, or cloud-VM idle timeout) may be closing the agent's outbound connection between heartbeats. Try reducing the agent's heartbeat interval (
-
Agent showing different versions or IP addresses
- Symptom: The Private tab of the Management Console Agents page displays different versions or IP addresses for a private agent, or the values cycle back and forth after restarting services.
- Possible cause: The agent's host machine may have been duplicated at the infrastructure level (for example, a VM clone, disk image, machine template, or snapshot created after the agent was installed and registered). The duplicate host carries the same agent
credentials.txt, so both hosts authenticate to Harmony as the same agent and run in parallel, colliding. Two agents cannot run simultaneously under the same credentials. - Resolution:
- Confirm a duplicate is running. Stop the agent on the host you intend to keep, wait 10 minutes, then refresh the Private tab of the Management Console Agents page. If the agent switches from Stopped back to Running, another host is reporting under the same identity.
- Identify and shut down the duplicate host.
- If the duplicate cannot be shut down, uninstall the agent, create a new agent with a different name, and reinstall it on the host you want to keep.
- Verify the new agent is listed as Running on the Private tab of the Management Console Agents page.
- Delete the old agent entry using Actions > Remove.
Agent shows Unknown or Stopped after reusing an agent group across operating systems
- Symptom: After migrating private agents to a different operating system (for example, Windows to Linux) while reusing the same agent group, the migrated agents intermittently show as Unknown or Stopped on the Private tab of the Management Console Agents page, even though
jitterbit statusshows the services running and operations run normally. - Possible cause: Reusing an agent group from the previous operating system can leave behind metadata that interferes with status reporting for the new agents. The effect is typically cosmetic: services and operations keep running normally.
- Resolution: Create a new, clean agent group for the migrated agents instead of reusing the group from the previous operating system, then register the agents there.
Agent sync failure: Project changes not applying
- Symptom: After deploying changes in Studio, the agent continues running the previous version of the project, or an operation fails because a newly added connection is not found on the agent.
-
Possible causes:
- The deployment used Configurable Deploy, which deploys only the selected workflows and operations. Any part of the project outside that selection remains at its previously deployed version on the agent.
- The component is not used in the logical flow of a deployed workflow. Unused components are not deployed, so a connection that no deployed operation references is not sent to the agent.
- A network timeout or authorization error occurred during the sync.
- Low disk space on the agent host prevented the synchronized project files from being written.
-
Resolution:
- Re-deploy the full project: in Studio, use Deploy, which deploys all of the project's operations, rather than a Configurable Deploy of only selected workflows or operations.
- Restart the agent services to force a fresh synchronization of all deployed projects.
- Review the agent logs for sync-related network timeouts or authorization errors.
- Check available disk space on the agent host. A full or nearly full disk can prevent the agent from writing synchronized project files. See Disk space and log accumulation.
Operations delayed or queued after project deployment
- Symptom: After deploying a project in Studio, triggered operations do not start immediately, or a brief backlog of queued operations appears.
- Cause: The environment is locked while the agent synchronizes the deployed project. No operations can execute during this window.
- Resolution:
- To measure how long sync locks are lasting, scan
jitterbit-agent.logforenvironment-deploy. Each log entry includes the environment ID and the sync duration in milliseconds. - Consistently long sync times indicate a large project or slow connectivity to Harmony. To reduce sync times, see environment sync performance tuning.
- If sync durations are consistently excessive (more than a few minutes), contact Jitterbit support.
- To measure how long sync locks are lasting, scan
Agent showing as incapable
-
Symptom: Operations submitted to the agent group are retried or delayed rather than running immediately.
ProcessEngine.logcontains repeated messages such as:Agent (Id: ...) is incapable to process this message. Message will be auto-retried.Capability status changed from true to false -
Possible causes:
- Every worker thread in the agent's process engine is already in use, so the agent cannot accept another operation until a thread frees up. The pool size is set by
MaxNumberOfWorkerThreadsin the[ProcessEngine]section ofjitterbit.conf. - An optional capability metric is enabled and has reached its threshold. CPU usage, memory usage, and Apache thread usage can each contribute to capability status, but all three are disabled by default and apply only when turned on in the
[AgentCapability]section ofjitterbit.conf. Memory usage is collected on Windows agents only, so it does not contribute to capability status on a Linux agent even when the memory settings are enabled. Apache serves API requests only, so Apache thread usage is relevant only on an agent that handles APIs. - A single agent in the group is handling more load than it can sustain while other agents in the group are idle or under-utilized.
- Every worker thread in the agent's process engine is already in use, so the agent cannot accept another operation until a thread frees up. The pool size is set by
-
Resolution: Review
ProcessEngine.logfor long sequences of capability status changes to confirm the agent is cycling in and out of incapable states, then investigate the following:- If many operations consistently run at once, review
MaxNumberOfWorkerThreadsin the[ProcessEngine]section ofjitterbit.conf. Increasing this value allows more concurrent operations but also increases CPU and memory demand, so set it conservatively. - Determine which capability metrics are enabled in the
[AgentCapability]section. If none are enabled, CPU and memory load are not what changed the agent's capability status, and thread availability is the more likely trigger. If CPU or memory usage is enabled, check it before the thread metrics: either one crossing its threshold makes the agent incapable regardless of thread availability. On a Linux agent, CPU usage is the only system resource metric that applies. - Check CPU and memory usage on the agent host at the time of the issue. If native observability is enabled, review the System Resource Capability, Apache Threads, and Tomcat Threads charts on the Metrics tab of the Management Console Agents page. When reviewing charts for a multi-agent group, use peak or maximum values rather than averages, as averages can mask a single overloaded agent while the rest of the group appears healthy.
- If the agent group contains multiple agents, check
ProcessEngine.logon all agents in the group to determine whether all agents were incapable simultaneously when the operation errored. If only one agent was incapable, the operation should have routed to a capable agent. Verify that load balancing is configured correctly for the group. - If resource limits are consistently reached, add agents to the group to distribute the load.
- If memory pressure is the trigger, see Java heap space:
OutOfMemoryError.
- If many operations consistently run at once, review
Transformation fails: "Failed to find file in the local file store"
-
Symptom: An operation fails during a transformation with an error indicating a file is missing from the agent's local file store:
Failed to find file in the local file store. Will attempt a re-sync the files in the environment the next time the operation runs. There is no file in the local file store. File_ID = ... Failed to find file in the local file store. TransformID: ..., FileID: ..., Error: There is no file in the local file store. File_ID = ... [CODE:10808] -
Possible cause: A file's deployment metadata did not fully synchronize from the Harmony cloud to the agent, so the agent cannot locate the file at runtime. This is usually transient (for example, a brief sync interruption), but it can also follow exporting and re-importing a project between environments.
- Resolution:
- Re-run the operation. On agent version 11.38 and later, the agent self-heals this condition: the error occurs at most once per file ID on a given agent, and the agent restores the missing metadata on the next environment sync (the next operation run or deployment). In most cases, running the operation again clears it.
- If the same file keeps failing across multiple runs on a current agent, a deeper issue is likely, such as an environment that has reached its deployment-record limit or a version-specific regression. Contact Jitterbit support with the failing operation name and the
TransformIDandFile_IDfrom the error.
Installation and upgrade errors
Error 1720 or 1722 on Windows installation
-
Symptom: The Windows private agent installation fails partway through, with either of these Windows Installer errors:
Error 1722. There is a problem with this Windows Installer package. A program run as part of the setup did not finish as expected. Contact your support personnel or package vendor. ...Error 1720. There is a problem with this Windows Installer package. A script required for this install to complete could not be run.Both errors mean that a step in the installer (a custom action, named in the Error 1722 message) did not complete. Most often the failing step is the installer's bundled-PostgreSQL setup, in which case the installer log may also show a
KoGetDbServiceorKoInstallPostgreSQLNewscript error, or[Microsoft][ODBC Driver Manager] Data source name not found and no default driver specified, and the bundled PostgreSQL database andjitterbitpostgresWindows service may not be fully created. The message can instead name a different action, such asInstallVerboseLogShipper. -
Possible causes:
- A missing or conflicting Microsoft Visual C++ Redistributable (the bundled PostgreSQL requires it).
- Forbidden characters in the PostgreSQL password.
- On a reinstall, leftover PostgreSQL components from a previous agent. The agent uninstaller does not remove PostgreSQL, the
jitterbitpostgresWindows user, or its registry entries by design, and these leftovers can prevent the new PostgreSQL setup from completing (for example, thejitterbitpostgresservice account cannot be recreated). - On a reinstall or upgrade, leftover verbose log shipper components from a previous agent. As with PostgreSQL, a standard uninstall does not remove the verbose log shipper service or its files, and these leftovers can cause the installer's
InstallVerboseLogShipperaction to fail. - On an upgrade from a prior advanced installation where PostgreSQL was configured to run under a Windows service account other than
jitterbitpostgres(for example,NT AUTHORITY\NetworkService), the upgrade could fail with Error 1720 on agent versions earlier than 12.10.
-
Resolution:
- Install the 64-bit Microsoft Visual C++ Redistributable for Visual Studio using
vc_redist.x64.exe(covers Visual Studio 2015, 2017, and 2019) before installing the agent, and keep it installed, because removing it during a cleanup also breaks the install. -
If the PostgreSQL password contains forbidden characters, change the password to a valid one before retrying the installation.
Note
In private agents 12.8 and later, the installer validates the PostgreSQL service account (
jitterbitpostgres) password against character restrictions at input time and prompts you to correct it before PostgreSQL is installed. -
If you are reinstalling after a previous agent, completely remove the leftover PostgreSQL first: follow Uninstall a Windows private agent, then confirm the
jitterbitpostgresWindows user, the PostgreSQL program and data directories, and the PostgreSQL registry keys are gone. - If the Error 1722 message names the
InstallVerboseLogShipperaction, remove the leftover verbose log shipper service and its files from the previous agent, then uninstall the agent again and reinstall. -
If the prior installation is an advanced installation with PostgreSQL running under a service account other than
jitterbitpostgres, upgrade to agent version 12.10 or later, which resolves this. On an earlier agent version, reconfigure the existing PostgreSQL service to run under thejitterbitpostgresWindows service account before upgrading.If the install still fails after a thorough cleanup, contact Jitterbit support.
- Install the 64-bit Microsoft Visual C++ Redistributable for Visual Studio using
PostgreSQL service removed after failed upgrade on Windows
-
Symptom: After a failed private agent upgrade on Windows, the PostgreSQL service (
postgresql-x64-<VERSION>) no longer appears in Windows Services, and the Jitterbit agent services fail to start due to a missing dependency. -
Cause: This occurs with private agent versions prior to 11.59 / 12.3 when an incorrect password is entered during the upgrade and the installer fails to roll back correctly. This issue is resolved in private agent 11.59 / 12.3 and later, where an incorrect password blocks the upgrade on the same dialog and allows re-entry or cancellation without affecting the existing installation.
-
Resolution:
- Open a command prompt as administrator.
-
Re-register the PostgreSQL service:
"C:\Program Files\PostgreSQL\<VERSION>\bin\pg_ctl.exe" register -N "postgresql-x64-<VERSION>" -D "C:\Program Files\PostgreSQL\<VERSION>\data"Replace
<VERSION>with your PostgreSQL version number. To find it, see PostgreSQL version bundled with the private agent. -
Start the PostgreSQL and PgBouncer services:
net start postgresql-x64-<VERSION> net start JitterbitPgbouncer -
Start all Jitterbit agent services:
"C:\Program Files\Jitterbit Agent\StartServices.bat" -
Once the agent is running, reset the PostgreSQL admin and service account passwords before re-attempting the upgrade.
Agent services fail to start after restarting Windows following an upgrade
-
Symptom: A Windows private agent upgrade from an 11.x agent to a 12.x agent earlier than 12.10 completes successfully, but the Jitterbit Agent services fail to start the next time the host system is restarted.
-
Possible cause: The upgrade leaves the previous PostgreSQL Windows service (
postgresql-x64-<VERSION>, where<VERSION>is the version installed by the prior agent) with its startup type still set to Automatic. On restart, this older service starts before the PostgreSQL service installed by the upgrade and occupies the same port, preventing the new PostgreSQL service, and therefore the agent, from starting. -
Resolution:
- Upgrade to agent version 12.10 or later, which removes the previous PostgreSQL service during the upgrade.
- On an earlier agent version, after upgrading, open Windows Services, identify the older
postgresql-x64-<VERSION>service (the one that predates the upgrade), and set its startup type to Manual or Disabled, or uninstall it, before restarting the host system. To check which version is currently bundled with the agent, run the command in Same version as bundled.
TFA prevents 64-bit Windows agent installation
- Symptom: Installing a 64-bit Windows private agent fails when two-factor authentication (TFA) is enabled on the organization.
- Resolution: Temporarily disable TFA, install the agent, then re-enable TFA. The Require Two-factor authentication (TFA) setting is on the User Management tab of an organization's policies, accessed from the Management Console Organizations page.
Recover a failed Windows installation
- Symptom: Installation or upgrade of a Windows private agent fails or leaves the agent in a broken state.
- Resolution: Completely uninstall the agent, then reinstall the agent software.
Linux non-root installation fails
- Symptom: The Linux Redhat Non-Root (x64) installer fails.
-
Resolution: Verify the following:
- The non-root user has
sudoprivileges. A system administrator must add the user to thewheelgroup. To check current group membership, rungroups. -
When logged in as the
jitterbituser, theJITTERBIT_HOMEenvironment variable is set to the installation location:echo $JITTERBIT_HOMEThe result should be
/opt/jitterbit. This is set by$HOME/.bashrc.d/jitterbitwhen the installation instructions are followed. To set it manually, run:. /opt/jitterbit/scripts/set.env -
If the installer instead fails with an
OPENSSL_3.4.0error, this is a known issue on RHEL 9.7 and later. See RHEL 9.7 and later non-root private agent installation shows an OpenSSL error in the private agent known issues for a workaround.
- The non-root user has
JDBC driver: "No suitable driver found"
- Symptom: A database connection fails because the required JDBC driver is not installed on the agent, with an error such as
No suitable driver found for jdbc:<subprotocol>://.... - Cause: Jitterbit does not ship with all JDBC drivers. The required driver must be installed manually.
- Resolution: Install the required driver manually: register it in
JdbcDrivers.confand copy the driver.jartoJITTERBIT_HOME/tomcat/drivers/lib/, then restart the agent. For the full steps, see Install a JDBC driver.
Connector not downloaded to agent
-
Symptom: Operations fail with errors indicating a connector is unavailable or not found on the agent, typically after a new connector version is released or after deploying a project that uses a connector the agent has not yet downloaded:
This connector was not found on the Jitterbit Agent. Please be patient with us while the connector is downloaded across the agents. This may take up to several minutes -
Possible causes:
- The connector version required by the project has not yet been downloaded from the cloud to the agent. This is often transient and resolves within a few minutes.
- For private agents: the agent cannot reach the Harmony cloud to download the connector.
-
Resolution:
- In Studio, open the affected connection and click Test. This triggers the agent to download the latest connector version from the cloud.
- If the connector still does not download, check whether the Disable Auto Connector Update organization policy is enabled. When it is, the Test button does not download connector versions. See Agent Management.
- To download the connector without changing the policy, go to the Management Console Agents page, select the agent group, and choose Action > Update connectors. This forces a connector update across the group and is not affected by the Disable Auto Connector Update policy.
- For private agents, verify the agent host can reach the Harmony cloud. See Agent offline or unreachable.
Agent installation cannot register through a corporate proxy
-
Symptom: A private agent installation on a host behind a corporate proxy fails during the initial registration step, and the installer reports that it could not reach the Harmony cloud:
Could not connect to Jitterbit Harmony cloud -
Possible causes:
- The proxy is blocking the agent's connection to the Harmony cloud during registration.
- The proxy requires authentication that the agent's proxy configuration does not supply. Private agents support proxy authentication, including an NTLM domain. See Proxy server for Jitterbit private agents.
-
Resolution:
- Configure the proxy during agent setup so the installer can reach the Harmony cloud through it, supplying the proxy credentials (and NTLM domain, if the proxy requires it). See Configure a proxy during agent setup.
- If registration still fails through the proxy, have your network team allow the Jitterbit domains and IP addresses through the proxy, or bypass the proxy for them. The region-specific Harmony URLs are documented in Allowlist information.
- Re-run the installer once the proxy is configured or the host can reach the Harmony cloud.
Performance and resource issues
Java heap space: OutOfMemoryError
-
Symptom: Operations processing large files or running many operations concurrently fail with:
java.lang.OutOfMemoryError: Java heap space -
Cause: The private agent's maximum Java heap size (
-Xmx) is too small for the workload (large files or high job concurrency). - Resolution:
- Increase the private agent's maximum Java heap. See Tomcat heap memory for how to change the
-Xmxvalue (for example, from-Xmx1024mto-Xmx4096m). - Restart the agent services after making the change.
- For operations that process large files, configure chunking to reduce per-job memory usage. Studio applies streaming transformations automatically where they qualify.
- If native observability is enabled, use the System Resource Capability chart on the Metrics tab of the Management Console Agents page to monitor memory usage over time and right-size the heap for the workload.
- Increase the private agent's maximum Java heap. See Tomcat heap memory for how to change the
Disk space and log accumulation
- Symptom: The private agent host runs out of disk space, which can cause PostgreSQL to shut down or operations to fail with permissions errors. Log and temporary files accumulate in the agent directories, especially on agents that process high volumes.
- Resolution:
- Check available disk space on the agent host.
- Identify large files. Agent logs and temporary files are under
JITTERBIT_HOME/log,JITTERBIT_HOME/tomcat/logs(catalina.out), andJITTERBIT_HOME/DataInterchange/Temp. See Log files for the full list. A single log file can grow to many gigabytes when a component logs excessively (for example, a verbose connector floodingcatalina.out) or when an error repeats (for example, a failed database connection repeating inProcessEngine.log). Clear oversized files if space is critically low; clearing the file and restarting the agent can also stop the underlying error. - Confirm the cleanup service is running and its retention is honored. In the
[FileCleanup]section ofjitterbit.conf, verifyAutoStartistrueand reviewFrequencyInHours. Per-directory retention is set inCleanupRules.xmlusingNumDaysorNumOfHours. - If the cleanup service cannot delete active log files (Tomcat keeps its
stdoutandstderrlogs open on Windows), raise theFileAgefor that directory inCleanupRules.xmlto at least one day so cleanup does not target files that are still being written. - If large
.dmpcrash-dump files are consuming the disk, see JVM mini-dump files fill the agent's disk.
Agent service restart loop
- Symptom: The agent's services repeatedly crash and restart. Tomcat or the Process Engine stops and starts in a loop without staying online, and operations fail with errors such as
Tomcat service is not running. Ifjitterbit statusshows all services healthy on the host but the displayed status only flaps between Running, Unknown, and Stopped, that is a connectivity problem rather than a crash loop. See Agent offline or unreachable. -
Possible causes:
- An orphaned Jitterbit process from a previous run (a Tomcat, Process Engine, or scheduler process) is still holding the service port, so each restart fails with
java.net.BindException: Address already in useand the agent cycles. - The host runs out of memory and the operating system terminates the process. This can happen when the host has too little memory for the workload, or when a container's memory limit is set too low.
- The agent host is low on disk space, or the internal PostgreSQL database has grown large enough to fail on startup.
- The Process Engine is crashing repeatedly under sustained load.
- An orphaned Jitterbit process from a previous run (a Tomcat, Process Engine, or scheduler process) is still holding the service port, so each restart fails with
-
Resolution:
- Confirm this is a true crash loop. Check the Tomcat logs in
JITTERBIT_HOME/tomcat/logs/andProcessEngine.logfor the exception logged at each restart. Ajava.net.BindException: Address already in useindicates that an orphaned process is holding the port. - Stop the agent and end any leftover Jitterbit processes before restarting it. With the agent stopped, check for stray processes: on Linux, run
ps aux | grep -E 'tomcat|jitterbit'andkillany remaining process IDs; on Windows, end any stray Jitterbit or Tomcat processes in Task Manager. Start the agent again once none remain. - Check for out-of-memory events. On Windows, review the Application and System logs in Event Viewer; on Linux, run
journalctl -u jitterbitor check/var/log/syslogfor OOM killer events. If the host is running out of memory, increase the available memory (or the container's memory limit). See Java heap space:OutOfMemoryError. - Check disk space and the internal database. A full disk or a bloated PostgreSQL database can crash the services on each restart. See Disk space and log accumulation.
- If the logs show the Process Engine crashing on a specific operation, contact Jitterbit support with the operation details and the agent logs.
- If native observability is enabled, open the Metrics tab of the Management Console Agents page and review the Tomcat and Process Engine service charts to identify when the services began failing.
- Confirm this is a true crash loop. Check the Tomcat logs in
Operations timing out or ignoring timeout settings
- Symptom: Operations run indefinitely or longer than expected. For API-triggered operations, timeout settings configured in Studio appear to have no effect, and operations can remain stuck in a Running status.
-
Possible causes:
- By default, operations triggered by API Manager APIs ignore Studio operation timeout settings. The
EnableAPITimeoutsetting injitterbit.confmust be explicitly enabled for API operations to respect timeout values. - No maximum operation runtime is set, so operations run without a hard time limit.
- By default, operations triggered by API Manager APIs ignore Studio operation timeout settings. The
-
Resolution:
- To enforce operation timeout settings for API-triggered operations, set
EnableAPITimeout=truein the[Settings]section ofjitterbit.conf. - To cap the total runtime of any operation, set
MaxOperationRuntimeSecondsin the[ProcessEngine]section ofjitterbit.conf. This requiresRunOperationsInSeparateProcessto betrue(the default). - Restart the agent services after making changes to
jitterbit.conf.
- To enforce operation timeout settings for API-triggered operations, set
Agent throughput unchanged after increasing max.concurrent.requests
- Symptom: After raising
max.concurrent.requestsinjitterbit-agent-config.properties, the agent's throughput does not improve. -
Possible causes:
- Only
max.concurrent.requestswas changed. Agent throughput also depends on the Tomcat and Apache thread pools and the HTTP connection pools, so raising this one setting without scaling the others in tandem produces no gain. - The agent host does not have enough CPU or memory for the added concurrency, or the agent is cycling into an incapable state under load.
- Only
-
Resolution:
- Follow the full tuning procedure rather than changing
max.concurrent.requestsalone, scaling the related thread pool and connection pool settings together. See Agent performance and tuning. - Confirm the agent host has adequate CPU and memory headroom for the higher concurrency. If the agent crashes or cycles into an incapable state under load, see Agent service restart loop and Java heap space:
OutOfMemoryError.
- Follow the full tuning procedure rather than changing
XML transformation slowdown after upgrading to agent 11.45 or later
- Symptom: After upgrading a private agent to version 11.45 or later, a transformation that iterates over a large array takes longer to run than it did on version 11.44. The slowdown is specific to mapping paths that use the
#notation to iterate over every element of a large array (roughly several hundred to a few thousand records). Transformations that do not iterate over large arrays are not affected. - Possible cause: The XML parsing library used by the agent was updated in version 11.45, and the updated version parses large XML data more slowly. This affects transformations that iterate over a large array, because the mapping repeatedly traverses the parsed data.
- Resolution:
- Review the transformation's mapping paths for the
#notation. If a path uses#to iterate over an array but only the first element is needed, remove the#and redeploy. Removing#maps only the first element, so apply this only where iterating over the full array is not required. - If the mapping must iterate over the full array, process fewer records per run by splitting a large dataset into smaller batches, so that each transformation traverses a smaller array.
- Review the transformation's mapping paths for the
JVM mini-dump files fill the agent's disk
- Symptom: The agent continuously generates large JVM crash files (
.dmpand.mdmpmini-dumps, andhs_err_pid*.logfiles) under<JITTERBIT_HOME>/Tomcat/temp(or, on older builds, theTomcatfolder directly), consuming the agent host's disk space. This affects Windows private agents on versions prior to 11.49. -
Possible causes:
- The agent's
AgentStatsdisk statistics collector crashes the JVM while gathering disk metrics. This affects agents on versions prior to 11.49. - On agents running 11.47 or 11.48, a separate crash in the Process Engine can produce the same crash files.
- The agent's
-
Resolution: Upgrade the private agent to version 11.49 or later, which resolves both causes.
If an immediate upgrade is not possible and the crash files come from disk statistics collection, you can disable that collection as a workaround (the
DiskStatsEnabledflag is available on agent 11.44.1 and later):-
In
jitterbit.conf, add:[AgentStats] DiskStatsEnabled=false -
Restart the agent services. Existing crash files can then be deleted safely to reclaim disk space.
- If you are on 11.47 or 11.48 and the crash files continue, upgrade to 11.49 or contact Jitterbit support for a workaround.
-
Database issues
TranDb connection failures
-
Symptom: Operations fail with errors referencing the private agent's internal PostgreSQL database, or internal agent services fail to start because its connection limit has been reached. Repeated failures can also flood
ProcessEngine.log, growing it to many GB:Failed to connect to back-end database 'TranDb'FATAL: query_wait_timeoutFATAL: remaining connection slots are reserved for non-replication superuser connections -
Possible causes:
- The internal PostgreSQL
max_connectionslimit, or the PgBouncermax_db_connectionslimit, is too low for the agent's workload. - Operations are backing up under heavy load or a network or endpoint slowdown, holding database connections until the PgBouncer pool is exhausted (
query_wait_timeout). - On a Windows agent, IP Helper is interfering with the agent's local database connections.
- The internal PostgreSQL
-
Resolution:
- Recent agent versions ship with higher PostgreSQL and PgBouncer connection limits by default, so first confirm the agent is on a current version. If a current agent still exhausts its connection limit, contact Jitterbit support to raise it under support guidance. The bundled PostgreSQL and PgBouncer instances should be changed only under support guidance.
- If the limits are already adequate, investigate what is holding connections open: review agent-host load and any upstream network or endpoint slowness that is backing operations up.
- On a Windows agent, disable IP Helper. See IPv6 issue on Windows.
Bundled PostgreSQL on Linux uses MD5 instead of SCRAM-SHA-256
- Symptom: You want to change the bundled PostgreSQL authentication method on a Linux private agent from MD5 to SCRAM-SHA-256, but the agent continues to use MD5.
-
Possible causes:
- MD5 is the default password encryption for the bundled PostgreSQL on Linux private agents. SCRAM-SHA-256 was the default only in versions 12.6 and 12.7; version 12.8 reverted the default to MD5. When you upgrade a Linux agent from 12.6 or 12.7, the installer prompts you to reset encryption to MD5 or keep SCRAM-SHA-256; see Upgrade a Linux agent.
- Editing
pg_hba.confandpostgresql.confalone does not complete the switch. PgBouncer must also be reconfigured with the SCRAM verifier hash, or the agent fails to start.
-
Resolution: To switch a Linux private agent to SCRAM-SHA-256, follow the SCRAM on PostgreSQL guide. SCRAM-SHA-256 is a stronger authentication method, while MD5 is more performant, so the switch is a deliberate, multi-step change: the guide reconfigures the bundled PostgreSQL, updates the user passwords, and reconfigures PgBouncer with the new hash. Reconfiguring the bundled instance is the supported way to enable SCRAM. Do not replace the bundled instance with your own PostgreSQL server to obtain SCRAM: agents using a PostgreSQL instance other than the bundled one are not supported.
PostgreSQL: Administrative fast shutdown
-
Symptom: All operations fail because the agent's database is unavailable (operations may stall in a Pending status), and the PostgreSQL log records a fast shutdown:
received fast shutdown requestConnecting operations may also report
FATAL: terminating connection due to administrator command. -
Possible causes:
- An external or system action stopped or restarted PostgreSQL: an OS reboot, a Windows update or scheduled task, or a monitoring or backup tool that restarts services.
- The agent host ran low on CPU or memory, crashing Tomcat and taking PostgreSQL down with it.
-
Resolution:
- Restart the PostgreSQL and Jitterbit agent services (or restart the agent host) to recover. If operations remain stuck in a Pending or Running state after PostgreSQL is back, contact Jitterbit support, as the agent's database connection pool may not have recovered.
- Identify what stopped PostgreSQL: check the OS event log (on Windows, Event Viewer) around the time of the failure for reboots, updates, scheduled tasks, service crashes, or backup and monitoring tools that restart services. Prevent or reschedule whatever is stopping it, and set the PostgreSQL service to restart automatically on failure.
- Check agent-host CPU and memory. If the Jitterbit services are crashing under load, see Agent service restart loop and Java heap space:
OutOfMemoryError.
Network and connectivity
Certificate handshake failure (TLS)
-
Symptom: Operations connecting to secure endpoints fail during the TLS handshake, with errors such as:
error:0A000152:SSL routines::unsafe legacy renegotiation disabledSSLHandshakeException: Received fatal alert: protocol_versionPKIX path building failed: unable to find valid certification path to requested target -
Possible causes:
- The endpoint uses TLS legacy renegotiation, which the agent blocks by default.
- The agent and the endpoint cannot negotiate a common TLS version or cipher. Version 11.x and version 12.x agents ship different security libraries, so an endpoint that fails to connect on an 11.x agent may succeed on a 12.x agent.
- The endpoint's certificate (or one of its intermediates) is not trusted by the agent because its issuing CA is not in the agent JRE's
cacertstrust store.
-
Resolution: From the agent host, run the following to confirm which TLS version the endpoint negotiates and whether the handshake succeeds at the network level:
openssl s_client -connect hostname:portThen apply the fix that matches the error:
- If the error is
unsafe legacy renegotiation disabled, setAllowUnsafeLegacyRenegotiation=truein the[Settings]section ofjitterbit.confand restart the agent. This setting requires agent version 11.39 or later. - If the error is
PKIX path building failed: unable to find valid certification path to requested target, the endpoint's certificate (or one of its intermediates) is not in the agent JRE'scacertstrust store. Usekeytool -importon the agent JRE'scacerts(default passwordchangeit) to import the missing certificate(s), then restart the agent services. For a SQL Server database reached through a Database connection, you can also resolve this in the connection's driver settings instead of the trust store, on both cloud and private agents. See SQL Server: Connection fails with a PKIX certificate path error. - If a TLS negotiation or handshake failure persists, particularly on an 11.x agent, upgrade to a current 12.x agent, which includes updated security libraries and an updated certificate trust store.
- If the error is
Salesforce sandbox connection fails with certificate mismatch
-
Symptom: A private agent connection to an endpoint that requires Server Name Indication (SNI) fails with a certificate mismatch, while the same connection succeeds from a cloud agent group or from a direct
opensslorcurltest on the agent host. The most common case is a Salesforce sandbox URL ending in.sandbox.my.salesforce.com:Certificate for <your-domain.sandbox.my.salesforce.com> doesn't match any of the subject alternative names: ...Other affected endpoints include hosts that share a single IP behind virtual hosting.
-
Cause: The TLS handshake is not including the SNI extension, so the server returns a default certificate instead of the one for the requested host. For a Salesforce sandbox, the load balancer returns the production certificate, whose names do not cover
*.sandbox.my.salesforce.com. SNI is sent by default, so when it is missing, something is suppressing or stripping it. -
Resolution:
-
Confirm SNI is the cause. From the agent host, compare the certificate returned with and without SNI:
openssl s_client -connect HOST:443 -servername HOST   # certificate when SNI is sent
openssl s_client -connect HOST:443                    # certificate when SNI is omitted
If the first returns the correct certificate and the second returns the mismatched one, SNI is the cause.
-
Check whether SNI is explicitly disabled in the agent's Java options, and remove it if so. On Windows, open the Registry Editor at
HKEY_LOCAL_MACHINE\SOFTWARE\WOW6432Node\Apache Software Foundation\Procrun 2.0\Jitterbit Tomcat Server\Parameters\Javaand edit theOptionsvalue; on Linux, checkJAVA_OPTSin/etc/sysconfig/jitterbit. Remove-Djsse.enableSNIExtension=falseif present (this setting suppresses SNI). Restart the agent services. - If SNI is still missing after that, a network device, proxy, or VM network stack between the agent and the endpoint is stripping it. Your network team must allow the SNI extension through.
If the connection also fails from a cloud agent group, SNI is not the cause. The server's certificate may not list the host in its Subject Alternative Names. For Salesforce, add the sandbox MyDomain URL to the Salesforce certificate, or see Certificate Subject Alternative Name (SAN) mismatch.
-
FTP: Data connection timed out
- Symptom: FTP login succeeds but file listing or file transfer hangs and times out.
-
Possible causes:
- The FTP connection mode (active vs. passive) is incompatible with the network or firewall configuration.
- The passive port range defined on the FTP server is not open in the corporate firewall.
-
Resolution:
- In the FTP connection settings, toggle the Passive Mode checkbox. Passive mode is generally preferred for agents behind a firewall.
- Confirm with your network team that the passive port range configured on the FTP server is open in the firewall between the agent and the FTP server.
- To capture detailed connection-level logs, enable curl debug logging by setting
CurlDebugDirin the[Settings]section ofjitterbit.conf. See Curl logs.
SSH: SFTP connection fails due to incorrect key file path
- Symptom: SFTP operations fail on a Windows agent even though the SSH key files are correctly installed.
- Cause: The
PrivateKeyFileandPublicKeyFilepath values in the[SSH]section ofjitterbit.confuse Windows backslash separators (\), which are not supported. - Resolution: Use forward slashes in all SSH key file paths in
jitterbit.conf, even on Windows (for example,C:/jitterbit/keys/id_rsa). See[SSH].
SFTP SSH settings missing or in the wrong jitterbit.conf section
-
Symptom: SFTP operations that use a private key for authentication fail with an empty private key file error after an agent upgrade or restart. SSH key settings added to the local
jitterbit.confmay also stop taking effect after the agent restarts.CURL_DEBUG_TEXT: Using SSH private key file '' CURL_DEBUG_TEXT: SSH public key authentication failed: Unable to extract public key from private key file -
Possible causes:
- Remote agent configuration is enabled (it is on by default), so settings managed through the Management Console Jitterbit Configuration tab take precedence. SSH key settings added only to the local
jitterbit.confmay then not take effect, or may not be retained after the agent restarts. - The SSH key settings (
PrivateKeyFile,PrivateKeyPassphrase,PublicKeyFile) are in the wrong section. Newer agent versions parse strictly and ignore SSH settings placed outside the[SSH]section (for example, under[SSL]).
- Remote agent configuration is enabled (it is on by default), so settings managed through the Management Console Jitterbit Configuration tab take precedence. SSH key settings added only to the local
-
Resolution:
- If remote configuration is enabled, add the SSH key settings there: open the Agent group details drawer for the agent group, select the Jitterbit Configuration tab, and add them under the
SSHsection. See Jitterbit configuration. - If the local
jitterbit.confis the configuration source, confirm the SSH key settings are placed under[SSH](not[SSL]). - Restart the agent services.
- For additional SFTP key-authentication troubleshooting (password fields, passphrase, key format), see SFTP "Login denied. Authentication failure." when using SSH keys.
- If remote configuration is enabled, add the SSH key settings there: open the Agent group details drawer for the agent group, select the Jitterbit Configuration tab, and add them under the
SFTP authentication failure to a specific server (cURL cipher mismatch)
-
Symptom: An SFTP connection using SSH key authentication fails on a private agent with
Login denied. Authentication failure., but other SFTP connections from the same agent (using the same key) succeed, and connecting to the failing server from the OS command line also succeeds.Failed to get ftp directory list for url sftp://... Login denied. Authentication failure. -
Cause: The SFTP server requires newer SSH ciphers, key-exchange, or host-key algorithms that the cURL library shipped in older agent versions does not support. Servers that still accept the older algorithms continue to work, which is why the same key succeeds against other hosts and from the OS command line.
- Resolution: Upgrade the private agent to version 11.37 or later, which includes an updated cURL library with support for current SSH ciphers, key-exchange, and host-key algorithms.
HTTPS proxy: Basic authentication through proxy tunnel fails
- Symptom: When the agent connects through an HTTPS proxy that requires basic authentication, connections through the proxy tunnel fail with an authentication error.
- Cause: Modern JDK versions disable basic authentication during HTTPS proxy tunneling by default. The JVM property
jdk.http.auth.tunneling.disabledSchemesblocks basic auth unless explicitly cleared. - Resolution: Add
-Djdk.http.auth.tunneling.disabledSchemes=""toCATALINA_OPTSbefore starting Tomcat. For step-by-step instructions for Windows, Linux, and Docker, see Allow basic authentication during HTTPS proxy tunneling.
Private agents in restricted networks: Outbound-only connectivity
- Symptom: When deploying private agents behind a strict corporate firewall or in a restricted environment (for example, OpenShift) alongside a private API gateway, network teams sometimes ask which inbound ports must be opened on the agent for Harmony or the gateway to reach it.
-
Cause: Private agents do not require any inbound ports to be opened, because of how agent connectivity works:
- Private agents do not accept inbound connections from Harmony or from a private API gateway. The agent establishes an outbound WebSocket connection to Harmony over HTTPS (port 443). All traffic from Harmony and from the gateway to the agent is routed back over this pre-established connection.
- A private API gateway sends API requests to Harmony, and Harmony routes the request to the appropriate agent over the existing outbound WebSocket. The agent routes the API response payload back to the private API gateway, so the agent must also be able to reach the gateway (directly, or through its load balancer in a multi-gateway deployment).
-
Resolution:
- Open outbound HTTPS (port 443) from the agent host to the Harmony region URLs. The connection upgrades to WSS (secure WebSocket) for ongoing bi-directional communication. No inbound ports need to be opened on the agent host for Harmony or for the gateway.
- When configuring the firewall, allowlist the region-specific Jitterbit services listed under Outbound communication, the section that applies to a private agent behind a firewall.
- If the agent has been configured to use non-default (custom) ports, allow those through the corporate firewall as well. See Network ports.
- If a private API gateway is deployed, also allow outbound connectivity from each agent host to the gateway (directly, or through its load balancer in a multi-gateway deployment). The agent connects to the gateway to return the API response payload. For the full request flow, see Private API gateway system architecture.
Custom API returns 504 but the operation log shows success
- Symptom: A custom API returns a 504 gateway timeout, but the operation log on the Management Console Runtime page shows the operation completed successfully.
- Cause: When a request or response payload (headers plus body, compressed) exceeds approximately 1 KB, the Jitterbit cloud API gateway stages the payload, and the private agent makes an outbound connection to the
jitterbitsysservicehost for its region to download the request payload (or upload the response payload) before completing the operation. If the agent's host cannot reach that host, the transfer times out and the API returns a 504 even though the operation itself ran. The standard agent connection check does not verify connectivity to thejitterbitsysservicehost, so the agent can appear fully connected while this host remains blocked. - Resolution:
- Add the
jitterbitsysservicehost for your region (for example,jitterbitsysservice.jitterbit.net) and its static IP addresses to the outbound allowlist on the firewall for the private agent's host. See Jitterbit allowlist information for the region-specific URLs and IPs. - Verify connectivity by running an HTTP test from the agent host to the
jitterbitsysserviceURL for your region, then confirm the API no longer times out.
- Add the
IPv6 issue on Windows
- Symptom: Some agents experience connectivity issues when IPv6 is enabled on the Windows host. This can manifest, for example, as operations stuck in a Pending state with a rapidly growing
ProcessEngine.log, when the IP Helper service crashes and the agent loses its connection to the internal database. -
Resolution: Disable both IPv6 and IP Helper on the Windows host.
Disable IPv6 as follows:
- Open Control Panel > Network and Internet > Network Connections.
- Open the Properties of the network connection.
-
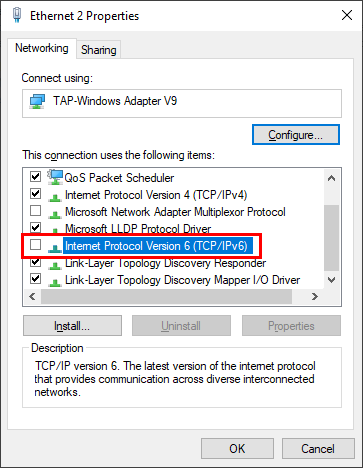
Clear the checkbox for Internet Protocol Version 6 (TCP/IPv6):
Disable IP Helper as follows:
- Open Services.
- Locate IP Helper, right-click it, and select Properties.
-
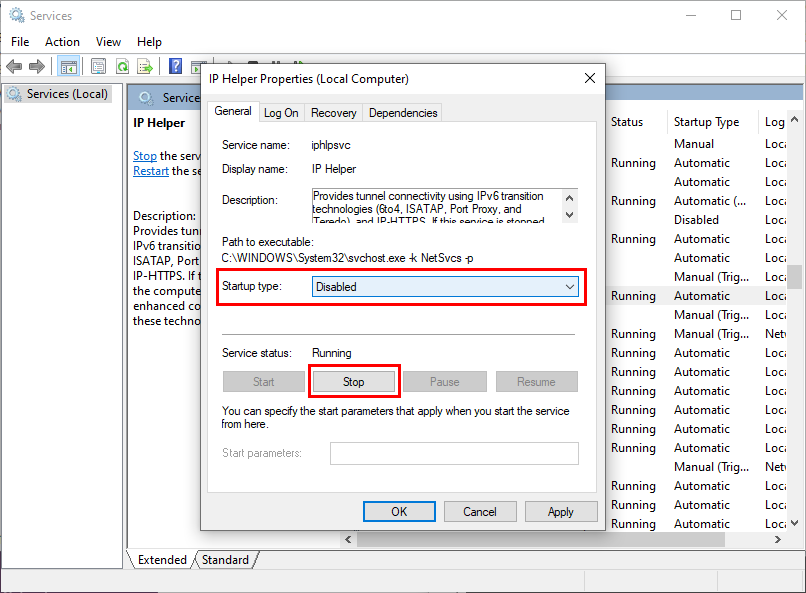
Click Stop, then set Startup type to Disabled:
Azure VM: Lost connections and WebSocket/I/O errors
This section covers troubleshooting for private agents installed on Microsoft Azure virtual machines (VMs). For general performance tuning, see Private agent performance tuning.
Lost connections
Azure sets the WebSocket idle timeout to 4 minutes, while the private agent's default heartbeat interval is 5 minutes. To resolve lost connections, reduce the heartbeat interval:
-
Open
jitterbit-agent-config.propertiesin a text editor:- Linux:
<JITTERBIT_HOME>/Resources/ - Windows:
C:\Program Files\Jitterbit Agent\Resources
- Linux:
-
Find the
agent.heart.beat.intervalsetting:#Agent heart beat interval (IN MINUTES) agent.heart.beat.interval=5 -
Change the value to
agent.heart.beat.interval=3. -
Save the file and restart the agent.
WebSocket and I/O errors
Important
Plan for the following steps to take over 30 minutes to complete.
WebSocket and I/O errors can be resolved by updating the Azure VM's IP idle timeout, NAT gateway TCP idle timeout, and virtual network (VNET) flow timeout each to 15 minutes. This is covered in the following steps.
Identify relevant errors
Check the operation logs and jitterbit-agent.log for the following messages.
Operation log errors:
The operation "Example Operation" completed successfully.
No message found while removing message in cache for: Message Info: AgentId: 000001 AgentGroupId: 000001 MessageId: XXX Message Version (Agent): XXXX Message Version (Harmony): XXX Counter (Harmony): 1 Submitted Timestamp (Harmony):2024-01-20 11:55:00.700 , message will be retried later OperationInstanceGUID: XXX
Run message could not reach the agent.
Agent log errors:
2024-01-20 12:00:00 request handler thread #10642  INFO org.jitterbit.integration.server.api.util.AgentRetryExecutor:53 - Agent Message Receipt (OperationInstanceGUID: XXX) failed. Retrying....
2024-01-20 12:00:00 request handler thread #10642 ERROR org.jitterbit.integration.server.api.util.AgentRetryExecutor:55 - org.springframework.web.client.ResourceAccessException: I/O error on PUT request for "https://na-east.jitterbit.com/jitterbit-cloud-restful-service/agent/ackmsgreceipt": Read timed out; nested exception is java.net.SocketTimeoutException: Read timed out
E:2024-01-20 12:00:00 request handler thread #884 ERROR org.jitterbit.integration.server.messaging.agent.listener.AgentMessageListener:231 - No message found while removing message in cache for: Message Info: AgentId: 000001 AgentGroupId: 000001 MessageId: XXX Message Version (Agent): XXXX Message Version (Harmony): XXX Counter (Harmony): 1 Submitted Timestamp (Harmony):2024-01-20 11:55:00.700 , message will be retried later OperationInstanceGUID: XXX
Important
Continue only if a WebSocket or I/O error was identified in either the operation logs or agent logs based on the above criteria.
Drain stop the agent
Drain stop the agent before updating any timeout settings. If there is more than one agent in the affected group, drain stop all of them.
Isolate agent resources
It is recommended that the agent's VM and its associated resources (VNET, IP, NAT gateway, NIC, and NSG) are separated into their own resource group in Azure.
Update the IP's idle timeout
-
In the Azure portal, navigate to the resource group associated with the agent's VM.
-
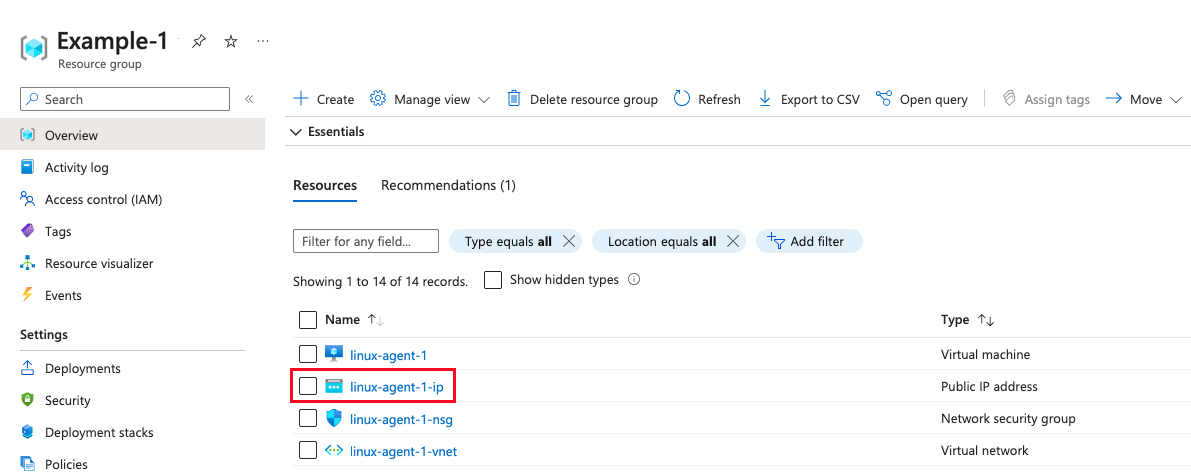
Click the IP item associated with the VM:
-
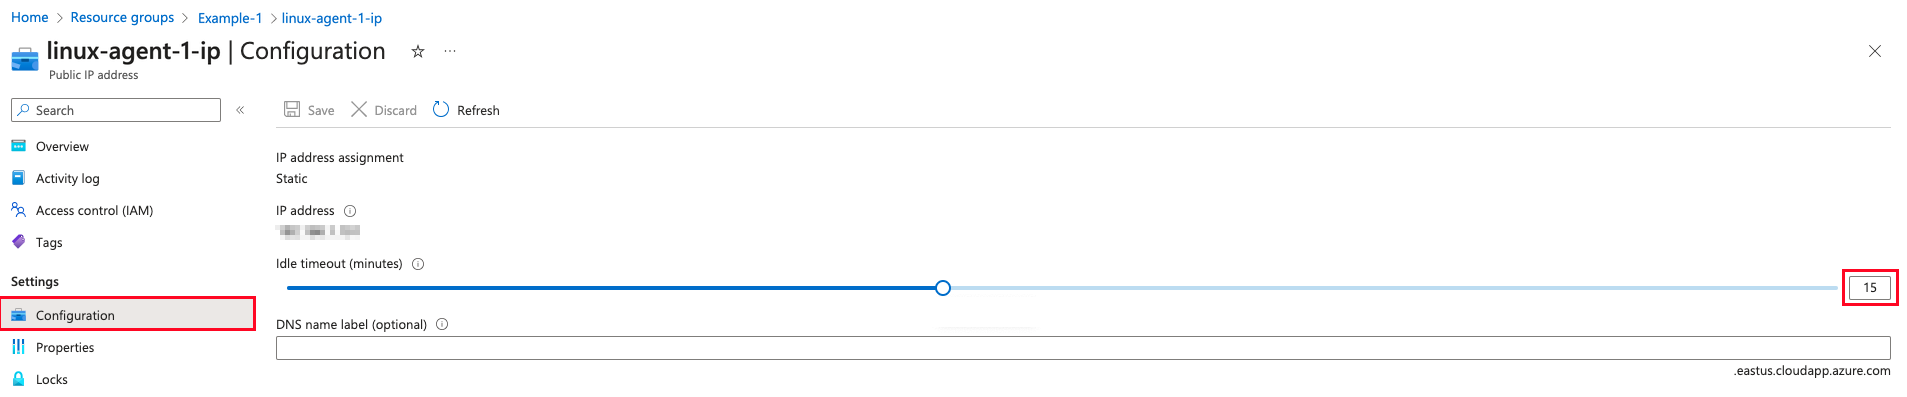
Click Configuration and set Idle timeout (minutes) to 15:
Update the NAT gateway's TCP idle timeout
-
In the Azure portal, navigate to the resource group associated with the agent's VM.
-
Click the NAT gateway item associated with the VM and IP. The associated NAT gateway is also listed in the IP item's Overview next to Associated to.
-
Click Configuration and set TCP idle timeout (minutes) to 15.
Update the VNET's flow timeout
-
In the Azure portal, navigate to the resource group associated with the agent's VM.
-
Click the VNET item associated with the VM:
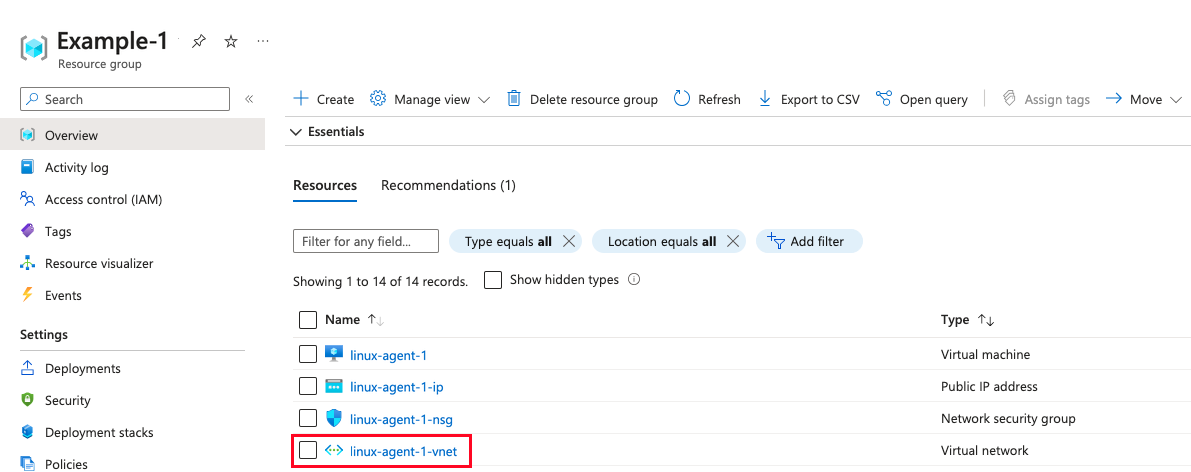
-
In Overview, click Configure next to Flow timeout:

-
Enable Enable flow timeout and set Flow timeout (minutes) to 15:

-
Click Save.
Restart the agent
Observability
Native observability not showing data
- Symptom: After enabling native observability, the Metrics tab of the Management Console Agents page shows no data, shows incomplete data, or charts remain empty after waiting several minutes.
-
Possible causes:
- The
[AgentMetrics]section injitterbit.confdoes not haveEnabled=true, preventing the metrics service from running. - Not all required settings in the
[AgentCapability]section are set totrue. - The agent services were not restarted after making configuration changes.
- The agent host cannot reach the Harmony cloud, preventing metrics from being submitted.
- Before agent version 12.10, upgrading a Windows private agent whose PgBouncer port was already
6434(see PgBouncer ports) did not update the metrics service's connection to match, so it remained on the old6432port and the PGBouncer metric could report incorrectly. - Before agent version 12.9, installing a private agent as a non-root user on Linux did not provision PgBouncer, so the service never started and its status always shows as unhealthy.
- The
-
Resolution:
- Verify that
jitterbit.confcontains all required settings from both the[AgentMetrics]and[AgentCapability]sections. See the complete configuration example in native observability setup. - Check
metrics.logandmetrics_service.login the agent log directory for errors. These logs record the status of the metrics service and indicate whether metrics are being collected and submitted. - Restart the agent services if any configuration changes were made.
- Verify the agent host can reach the Harmony cloud. See Agent offline or unreachable. If the agent connects through a proxy, see Agent metrics missing when the agent connects through an HTTP proxy.
- For an agent affected by the port mismatch, upgrade to agent version 12.10 or later, which corrects the metrics service's PgBouncer connection port automatically. If the mismatch persists after upgrading, contact Jitterbit support to verify the port.
- For a new non-root Linux private agent, use version 12.9 or later, where PgBouncer is correctly provisioned during installation. Upgrading an existing non-root Linux agent to 12.9 or later does not provision PgBouncer retroactively; the agent must be freshly installed.
- Verify that
Agent metrics missing when the agent connects through an HTTP proxy
- Symptom: The private agent connects to Harmony successfully through a configured HTTP proxy, but the Metrics tab of the Management Console Agents page shows no data. The
metrics.logfile may contain entries such asClient.Timeout exceeded while awaiting headers. - Cause: The agent submits metrics over HTTPS using a separate connection that does not inherit the agent's proxy configuration. If the proxy supports only HTTP, or is not configured for the agent's metrics traffic, metrics cannot reach Harmony even though the agent itself connects successfully.
- Resolution:
- Confirm the proxy supports HTTPS. Agent metrics are submitted over HTTPS, so a proxy that handles only HTTP traffic blocks them. Enabling HTTPS on the proxy resolves the issue.
- If you cannot enable HTTPS on the proxy, or metrics are still missing after you enable it, the agent's metrics traffic needs its own proxy configuration, separate from the agent's. Contact Jitterbit support to set it up.
Datadog agent fails to start after Docker installation
- Symptom: After installing the Datadog agent inside a Docker container as part of the Datadog observability setup, the Datadog agent fails to start.
- Cause: A known Datadog issue causes the agent to fail on startup when the security agent configuration file does not exist.
-
Resolution: Copy the example security agent configuration file:
cp /etc/datadog-agent/security-agent.yaml.example /etc/datadog-agent/security-agent.yamlThen start the Datadog agent. Note that on Docker, the Datadog agent does not start automatically with the container and must be started manually after each container start:
sudo datadog-agent run
System and OS issues
Apache Server error: No installed ConfigArgs
-
Symptom: The agent returns:
No Installed ConfigArgs for the Service "Jitterbit Apache Server" -
Cause: The account running the Jitterbit Apache server does not have full access to the Jitterbit installation directory.
- Resolution: Grant the service account full access to the Jitterbit installation folder and restart the services.
Apache/Tomcat: APPARENT DEADLOCK
-
Symptom: Under sustained load, the agent stops processing operations and may show as stopping in the Management Console. The agent log contains:
ThreadPoolAsynchronousRunner: APPARENT DEADLOCKThe log may also show
An existing connection was forcibly closed by the remote hostfor the agent's PostgreSQL database. Restarting the agent restores normal operation temporarily, after which the deadlock recurs under load. -
Possible causes:
- The agent's database connection pool deadlocks when the internal PostgreSQL database runs out of available connections under heavy load.
- The agent's Java database connection pool (shown as
c3p0in the log) cannot recover after a database connection is briefly lost, for example during a transient network interruption, even though PostgreSQL itself remains healthy and responsive with default timeouts. - Stale Jitterbit processes are holding threads and database connections. This can occur when an agent is upgraded while operations are still running, or when the services are stopped without all Jitterbit processes ending cleanly.
- The agent host is overloaded by peak activity, or its CPU is being throttled. For example, a burstable cloud instance (such as an AWS
t3type) throttles its CPU once its burst credits are exhausted, which can starve the internal PostgreSQL under load.
-
Resolution:
- Stop all Jitterbit services, end any Jitterbit processes that are still running, then start the services again to clear the deadlock.
- If the deadlock is in the Java (
c3p0) connection pool and PostgreSQL itself is healthy, switch the agent to its internal C++ connection pool by settingUseInternalPooling=truein the[DbInfo]section ofjitterbit.conf, then restart the agent. The internal pool recovers from dropped or stale connections more reliably. On fresh installations of Windows private agents version 12.5 and later, this is already enabled by default. - Reduce the load on the agent: schedule operations to avoid peak-activity spikes, add agents to the agent group for load balancing, and confirm the host meets the system requirements. For cloud hosts, use an instance type with sustained (non-burstable) CPU performance.
- Before upgrading an agent, drain stop it and let running operations finish, so that no processes are left holding database connections during the upgrade. In busy environments, allow extra time for the drain stop to complete.
Apache crashes unexpectedly under concurrent load
- Symptom: Under concurrent load, the agent's Apache process crashes and restarts unexpectedly, and the agent may briefly show as stopping or restarting in the Management Console. Operations that were running at the time can fail or be left in an incomplete state.
- Possible causes:
- A script uses nested
RunOperationcalls to run a child operation synchronously (the default) from a parent operation, and both operations read or write the same global variable at the same time. - A transformation is configured with chunking and multiple threads, and one thread finishes running before another thread that started at the same time.
- Multiple operations with component input and output data generation enabled run at the same time.
- A script uses nested
- Resolution: Upgrade the private agent to version 12.10 or later, which resolves these issues. No workaround exists on earlier versions.
Cleanup service cannot remove locked log files on Windows
-
Symptom: Log files on a Windows private agent grow indefinitely, and the cleanup service does not remove them. The cleanup service log reports an error such as:
Failed to remove file, retries (10) exhausted: '...\jitterbit tomcat server-stdout.<date>.log'. Reason: The process cannot access the file because it is being used by another process. -
Possible causes:
- An agent process is holding the file open. On Windows, the cleanup service cannot remove a file that is in use, and Tomcat keeps its
stdoutandstderrlog files open while it runs. - Third-party software (antivirus or a monitoring agent) is holding a lock on files in the agent's log directory.
- An agent process is holding the file open. On Windows, the cleanup service cannot remove a file that is in use, and Tomcat keeps its
-
Resolution:
- Edit
CleanupRules.xmlto shorten the retention (FileAge) for the affected log directories, so files are removed promptly once they are no longer in use. Restart the agent after editing the file. - Exclude the continuously written Tomcat
stdoutandstderrlogs from the cleanup rules, so the service does not repeatedly retry files that stay locked while the agent runs. - If third-party software is involved, add the Jitterbit installation and log directories to its exclusion list.
- If logs keep growing even with valid cleanup rules, contact Jitterbit support.
- Edit
Linux: Agent services fail to start after a reboot ("postmaster.pid does not exist")
-
Symptom: After rebooting a Linux private agent host, the agent services fail to start. Running
sudo jitterbit statusshows scheduler and other services not running, and the agent logs (or console) include errors such as:postmaster.pid does not existreindexdb: could not connect to database template1: could not connect to server: No such file or directory -
Cause: File permissions on the bundled PostgreSQL data directory are too permissive. PostgreSQL requires the data directory to be
700(owner-only). If permissions are looser (for example,755or777), PostgreSQL refuses to start, which prevents the rest of the agent from starting. -
Resolution:
-
Confirm
/opt/jitterbitand its subdirectories are owned by thejitterbituser and group:sudo chown -R jitterbit:jitterbit /opt/jitterbit -
Set the PostgreSQL data directory to
700:sudo chmod 700 /opt/jitterbit/DataInterchange/pgsql/data -
Start the agent services:
sudo /etc/init.d/jitterbit start
-
Linux: Antivirus removes PgBouncer, agent fails to authenticate to the bundled database
-
Symptom: After migrating a Linux private agent to a new host (or performing a clean install), the agent services fail to start. The
postgresql.logshows:[FATAL] password authentication failed for user "jitterbit"The agent log shows it cannot connect to the database. The failure persists across complete uninstall and reinstall.
-
Cause: A host-based antivirus or endpoint protection product detects the bundled PgBouncer binary as suspicious and removes or quarantines it. Without PgBouncer, the agent cannot authenticate to its internal PostgreSQL database.
-
Resolution:
- Temporarily disable the antivirus or endpoint protection product on the agent host.
- Add the Jitterbit installation directory (typically
/opt/jitterbit) to the antivirus exclusion list. -
Reinstall the agent. On RHEL/CentOS:
sudo dnf reinstall jitterbit-agent -
Start the agent services and confirm normal operation, then re-enable the antivirus with the exclusion in place.
Security scans flag log4j-over-slf4j.jar as a Log4j 1.x vulnerability
- Symptom: A security scan of a private agent installation flags files such as
log4j-over-slf4j-1.7.21.jaras an end-of-life Log4j 1.x vulnerability. - Resolution: No action is required.
log4j-over-slf4j.jaris not Log4j 1.x. It is part of the SLF4J logging framework and acts as a bridge that redirects calls from third-party libraries written against the Log4j 1.x API to the agent's current, supported logging framework. The file does not contain the vulnerable Log4j 1.x code. Its presence is the agent's mitigation against Log4j 1.x exposure, not an instance of the vulnerability.
Docker
General
The following points apply to Docker-related issues:
-
A Docker private agent will not start if the
confdirectory contains both acredentials.txtfile and aregister.jsonfile. -
Running private agents on Kubernetes is not officially certified by Jitterbit, and Jitterbit has not validated a production-ready Kubernetes configuration. The Helm chart and Kubernetes steps are provided as a starting point for testing or further development only.
Agent fails to restart with authentication errors after deregistration
-
Symptom: An agent configured with
deregisterAgentOnDrainstop=true(or theAUTO_REGISTER_DEREGISTER_ON_DRAINSTOPenvironment variable) fails to restart after being stopped. This applies to Docker agents that use a persistent volume for/opt/jitterbit/Resources, and to non-containerized Linux agents. -
Cause: When the agent stops with
deregisterAgentOnDrainstop=true, it deregisters from Harmony but the now-invalidcredentials.txtfile remains on disk. On restart, the agent attempts to use the stale credentials and fails to authenticate.Note
As of Docker agent version 12.4, restarting the container when
deregisterAgentOnDrainstop=trueis enabled automatically deregisters the existing agent and registers a new one. The steps below apply to Docker agents on earlier versions, and to Linux agents on any version. -
Resolution: Remove the stale
credentials.txtfile, then restart the agent to trigger a new registration.On a non-containerized Linux agent, remove the file directly:
rm /opt/jitterbit/Resources/credentials.txtOn a Docker agent, remove the file from the mounted volume:
docker run -i --rm -v VOLUME_NAME:/opt/jitterbit/Resources jitterbit/agent rm -i /opt/jitterbit/Resources/credentials.txtReplace
VOLUME_NAMEwith the Docker volume name under which/opt/jitterbit/Resourcesis mounted.
Listening service
"Cluster has not met the minimum required size"
-
Symptom: Operations using the Listening service fail with:
Failed to enable events for operation. Cluster has not met the minimum required size. -
Possible causes:
- Too few of the agents in the agent group are running and joined to the cluster. For a group of \(N\) agents, counted regardless of whether each agent is running, \((N / 2) + 1\) agents (rounded down) must be running and part of the cluster.
- One or more agents lost their connection to the cluster and could not rejoin, dropping the number of running, joined agents below the required \((N / 2) + 1\).
- A network interruption split the agent group into multiple smaller clusters. For example, in a group of 4 agents, a network split can produce two clusters of 2 agents each; neither meets the required \((N / 2) + 1\) of 3, so both report the error even though every agent is running.
-
Resolution:
- Confirm that \((N / 2) + 1\) of the agents in the group are running and part of the cluster, where \(N\) is the number of agents registered in the agent group, whether or not each one is running. For example, a group of 4 agents requires 3, and a group of 5 agents also requires 3. To see which agents have joined, use the Listening service REST API to show the cluster status.
- Verify that TCP ports 5701 and 5801 are open between all agent hosts and are not blocked by antivirus or firewall rules.
- If the cluster is down and messages remain unprocessed with persistence enabled, restore the cluster manually. See Cluster restore after agent failure.
Note
An odd number of agents in the agent group is recommended but not required. With an even number, a network interruption can leave the group split into two halves, neither of which is large enough to keep the cluster running.
Listening service messages not delivered
- Symptom: The cluster's retry mechanism silently drops undelivered messages after a configured period, causing dependent operations to not execute.
- Resolution: To extend the retention window or prevent deletion, edit
JITTERBIT_HOME/Resources/jitterbit-agent-config.propertiesand setagent.sdk_framework.retry.deleteRetryableMessageAfterto a higher value (in minutes). To retain all messages indefinitely, set the value to-1. Restart the agent after making changes.
Logging
Custom API operation logs not appearing
- Symptom: An operation triggered by a custom API runs without errors, but no log entry appears in Studio or on the Management Console Runtime page.
- Cause: When a custom API triggers an operation, operation logs are generated only when the operation is unsuccessful. Successful custom API operations produce no log entry by default.
- Resolution: To capture logs for successful custom API operations, enable operation debug logging for the operation. Note that API Manager has its own separate logging view for API requests.
Operation debug logging stops before the selected end date
- Symptom: Operation debug logging was enabled with a future end date, but logs stop being generated before that date is reached.
- Cause: On cloud agent groups, the end date of the operation debug logging setting is unreliable. Logs may stop being generated before the configured time period ends.
- Resolution: Re-enable operation debug logging as needed.
Operation debug log files missing .input or .output data
- Symptom: On a private agent, an operation has operation debug logging enabled with component input and output data turned on. The debug log folder in
DataInterchange/Temp/Debugcontains the.jtrfiles for each step, but the corresponding.inputand.outputdata files are missing. -
Possible causes:
- The agent's cleanup service is deleting
.inputand.outputfiles before they can be reviewed. - The agent restarted while the operation was still running, so the files were never written to completion. See Component input/output data not generated for that scenario.
- The agent's cleanup service is deleting
-
Resolution:
- On the agent host, open
CleanupRules.xmlin the agent installation directory. -
Find the cleanup rule for the
DataInterchange/Temp/Debugdirectory and increase the<FileAge NumDays = "2"...>value to a longer retention window (for example, 7).<CleanupRule> <DirectoryPath SearchSubDirectory = "YES" >DataInterchange/Temp/Debug</DirectoryPath> <Pattern>*</Pattern> <FileAge NumDays = "7" Comparator = "GE"/> <FileSize Size = "0" Comparator = "GE"/> </CleanupRule> -
Restart the agent services.
- On the agent host, open
Component input/output data not generated
- Symptom: Operation debug logging is enabled with component input and output data generation turned on, but no input/output data files appear for private agent operations.
-
Resolution: Check the Verbose Log Shipper service log on the agent:
<JITTERBIT_HOME>/VerboseLogShipper/verbose-log-shipper.out.logIf the log shows errors, restart the Verbose Log Shipper service. On Linux, this can be done without a full agent restart:
jitterbit stop verboselogshipper
jitterbit start verboselogshipper
On Windows and Linux, restarting all Jitterbit agent services also restarts the Verbose Log Shipper service.