Operation debug logging for Jitterbit private agents
Introduction
Operation debug logging generates additional diagnostic information to help with troubleshooting. This feature produces two types of logs:
-
Operation debug log files: Debug messages for each operation activity, including information logged before and after each transformation executes. Files are written to the private agent and are subject to the retention policy configured in the agent's cleanup rules (1 day by default).
-
Component input and output data: The request and response data processed by each activity and transformation in an operation. This data is available for operations running on private agents version 10.48 or later. Harmony retains this data for 30 days.
Warning
When component input and output data are generated, all request and response data for that operation are logged to the Harmony cloud and remain there for 30 days. Personally identifiable information (PII) and sensitive data such as credentials provided in a request payload will be visible in clear text in the input and output data within the Harmony cloud logs.
Because of these security implications, use operation debug logging only for debugging problems during testing. Do not enable this feature in a production environment. Generated debug log files may be large in quantity and/or size.
Note
The steps to enable logging of all API operations for the entire agent differ from the steps outlined in Entire private agent later on this page. For information on enabling API operation logging for the entire agent, see API Operation.
Enable operation debug logging
Operation debug logging can be enabled on an individual operation or on an entire private agent. Component input and output data are generated by default on private agents 10.48 or later but can be disabled using additional settings in the private agent configuration file.
Individual operation
Operation-level debug logging can help if you are having issues with an individual operation and do not need to turn on debug logging at the agent level, which may generate files that are large in quantity and/or size.
You can enable debug logging for an individual operation using either Studio operation options or Design Studio operation options:
-
Studio: Use an operation's actions menu to select Settings. In the Options tab, select Enable Debug Logging Until and set a date for debug logging to be turned off. The option to cascade the debug mode settings to any child operations is also available.
-
Design Studio: Right-click the background of any operation and select Options. In the Operation Options window, select Enable Debug Mode Until and set a date for debug logging to be turned off.
This date is limited to 2 weeks from the current date. Operation debug logging turns off at the beginning of this date (that is, at 12:00 am) using the agent time zone.
Entire private agent
Agent-level operation debug logging can be enabled from the private agent configuration file for all operations running on a private agent.
Caution
Enabling debug logging at the agent level may create very large files in the directory of each private agent within the private agent group. If you are having issues with an individual operation, consider enabling debug logging for an individual operation instead.
To enable debug logging, edit the private agent configuration file as follows, and then restart Jitterbit services.
-
Under the
[TransformationEngine]section, setWriteLog=true. -
Under the
[OperationEngine]section, setDebug=true.
The files created in this directory can become very large. Turn off debug logging as soon as you can, and delete the files when they are no longer needed.
Additional settings
Private agents that are version 10.48 and later have the section [VerboseLogging] present in their private agent configuration file with the setting verbose.logging.enable=true, which enables generation of component input and output data:
[VerboseLogging]
verbose.logging.enable=true
When upgrading an earlier private agent version to 10.48 or later, the generation of input and output data is automatically enabled by default, even if the [VerboseLogging] section and the verbose.logging.enable setting are not present in the configuration file.
To disable generation of component input and output data, you must add the [VerboseLogging] section and set verbose.logging.enable=false to prevent component input and output data from being logged to the Harmony cloud.
Additional settings in the [VerboseLogging] section should not be changed unless instructed by Jitterbit support.
View operation logs
The location where you view operation logs depends on the type of log generated:
-
Operation debug log files: Access via the Download agent logs icon on the Management Console Agents page, the Debug files tab of the Management Console Runtime page, or directly on the agent host. For details, see Debug log file access.
-
Component input and output data: View in Studio operation logs from the operation's View Logs menu or on the Management Console Runtime page.
Operation debug log files
Once operation debug logging is enabled on a Studio operation, Design Studio operation, or entire private agent, operation debug log files for the applicable operations are generated when those operations are executed.
Debug log file access
Operation debug log files can be accessed via the Download agent logs icon on the Management Console Agents page, the Debug files tab of the Management Console Runtime page, or directly on the agent host in the following locations:
C:\Program Files\Jitterbit Agent\DataInterchange\Temp\Debug
/usr/local/jitterbit/DataInterchange/Temp/Debug
To change the operation debug log directory, edit the private agent configuration file as follows, and then restart Jitterbit services:
- Under the
[TransformationEngine]section, setWriteLogDirto the desired directory location.
Debug log file retention policy
By default, operation debug log files are deleted automatically after 1 day.
This time period is configurable in CleanupRules.xml, which is accessible on private agents in these default locations:
C:\Program Files\Jitterbit Agent
/usr/local/jitterbit/
Within the CleanupRules.xml file, you can edit this cleanup rule to change the operation debug log retention policy:
  <CleanupRule>
      <DirectoryPath SearchSubDirectory = "YES" >DataInterchange/Temp/Debug</DirectoryPath>
      <Pattern>*</Pattern>
      <FileAge NumDays = "1" Comparator = "GE"/>
      <FileSize Size = "0" Comparator = "GE"/>
  </CleanupRule>
Debug log file contents
Operation debug log files contain debug messages for each operation activity and include information that is logged before and after each transformation is executed. Information about other actions such as reading from and writing to the Harmony cache is also included.
These files are typically requested by Jitterbit support if more information is required during troubleshooting.
Component input and output data
Prerequisites
Component input and output data is generated when all of the following conditions are met:
-
A Studio operation has operation debug logging enabled at the operation level.
-
The operation is executed on a 10.48 or later private agent.
-
The private agent has the default configuration settings.
-
The private agent is not communicating via a proxy server.
-
AlwaysDeleteTempDirin the[OperationEngine]section of the private agent configuration file is set tofalse(the default). When set totrue, temporary operation files are deleted before they can be captured, and no input or output data will be available in operation logs.
Caution
The generation of component input and output data is unaffected by the agent group setting Cloud logging enabled. Component input and output data will be logged to the Harmony cloud even if cloud logging is disabled.
To disable generation of component input and output data on an agent group, in the private agent configuration file under the [VerboseLogging] section, set verbose.logging.enable=false.
Input and output data
Input and output data are available only for activities and transformations used as operation steps.
Component input and output data is accessed from the Studio operation log screen or the Management Console's Runtime page in additional table rows shown for each operation step that has input and output data. In the left panel, icons for activities and transformations used as operation steps are displayed. You can click an operation step to show or hide the component input and output data for that individual operation step. Each input and output log entry is limited to 100 MB. If the data for an individual input or output log entry exceeds 100 MB, no data will be displayed.
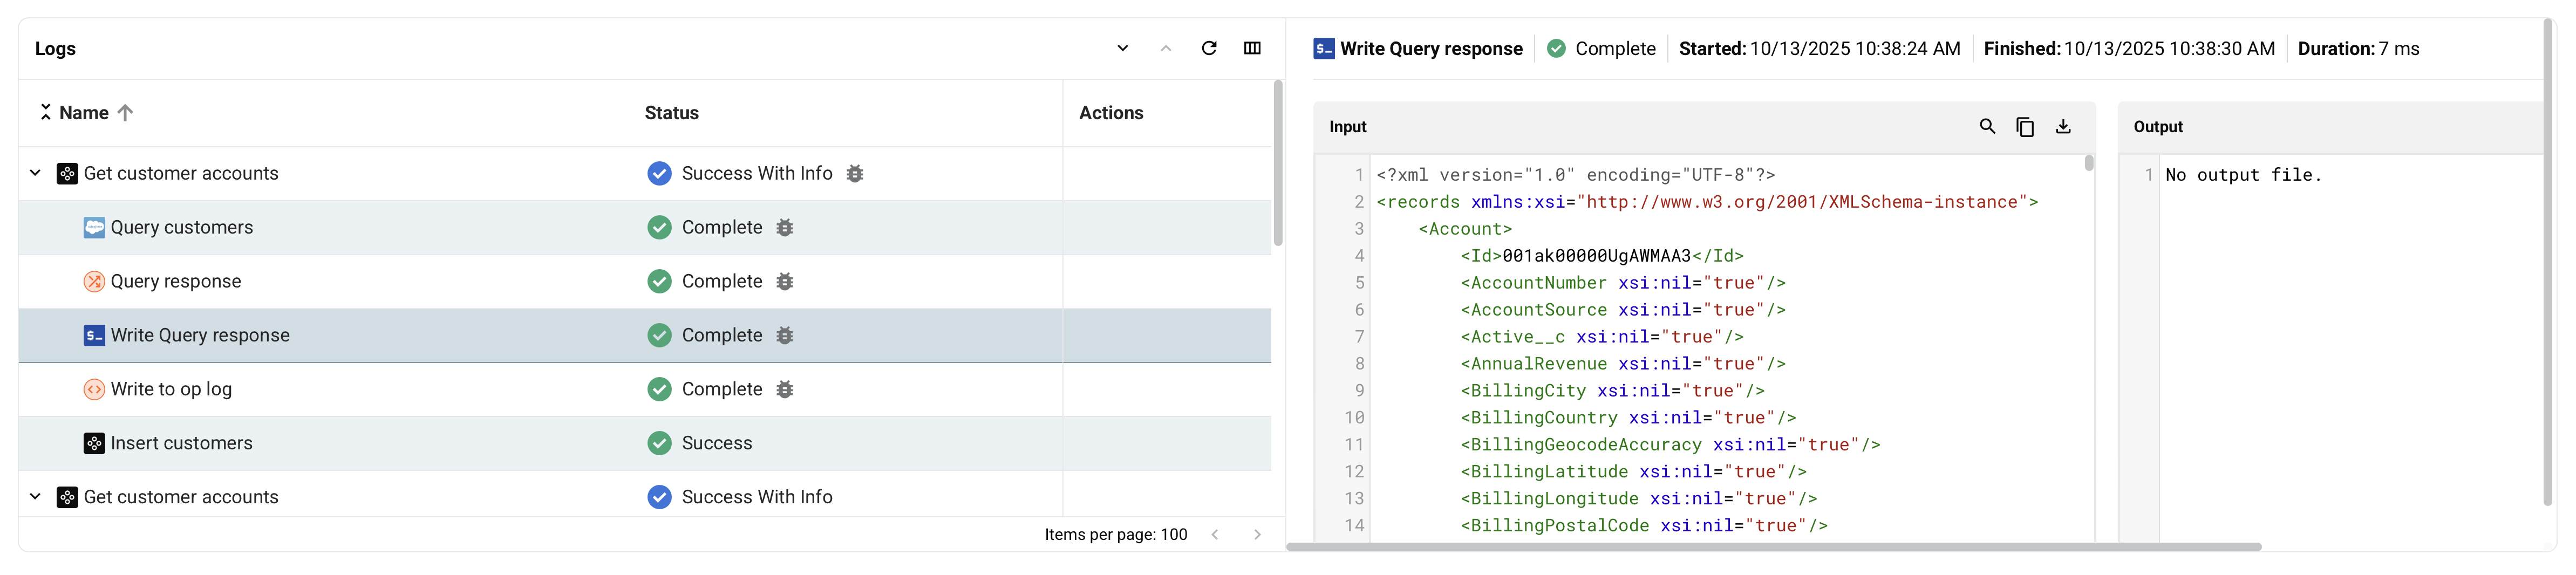
- Search: Search the data for the entered text.
- Copy: Copies the log data to your clipboard.
- Download: Downloads the input or output data. The file is named with the operation step name followed by
_inputor_outputas appropriate.
Input and output data retention policy
Component input and output data is retained for 30 days by Harmony.
Input and output data contents
Component input and output data is generated for certain steps of an operation. The data is appropriate to the function of a step. The input is the structure that the component consumes, while the output is the structure that the component produces.
Input and output data is generated for these components used as operation steps:
-
Activities: Input and output data and any related information for the execution of the activity. Some activities may have multiple input and output files.
-
Transformations: Input and output data for the execution of the transformation.
Input and output data is not applicable to scripts when you use them as operation steps. Script content, such as that produced by the WritetoOperationLog function, is displayed in the log messages of an operation log.
Input and output data troubleshooting
Agent logs related to the input and output data should not normally need to be accessed. If you think there may be an issue with generating the input and output data, you can check the Verbose Log Shipper service log files on a private agent:
<JITTERBIT_HOME>/VerboseLogShipper/verbose-log-shipper.out.log
The Verbose Log Shipper service can be restarted by restarting a private agent.
On Linux private agents, you can also disable and re-enable this service using these Jitterbit command line options:
jitterbit start verboselogshipper
jitterbit stop verboselogshipper
These options can also be viewed using jitterbit --help.