API logs page in Jitterbit API Manager
Introduction
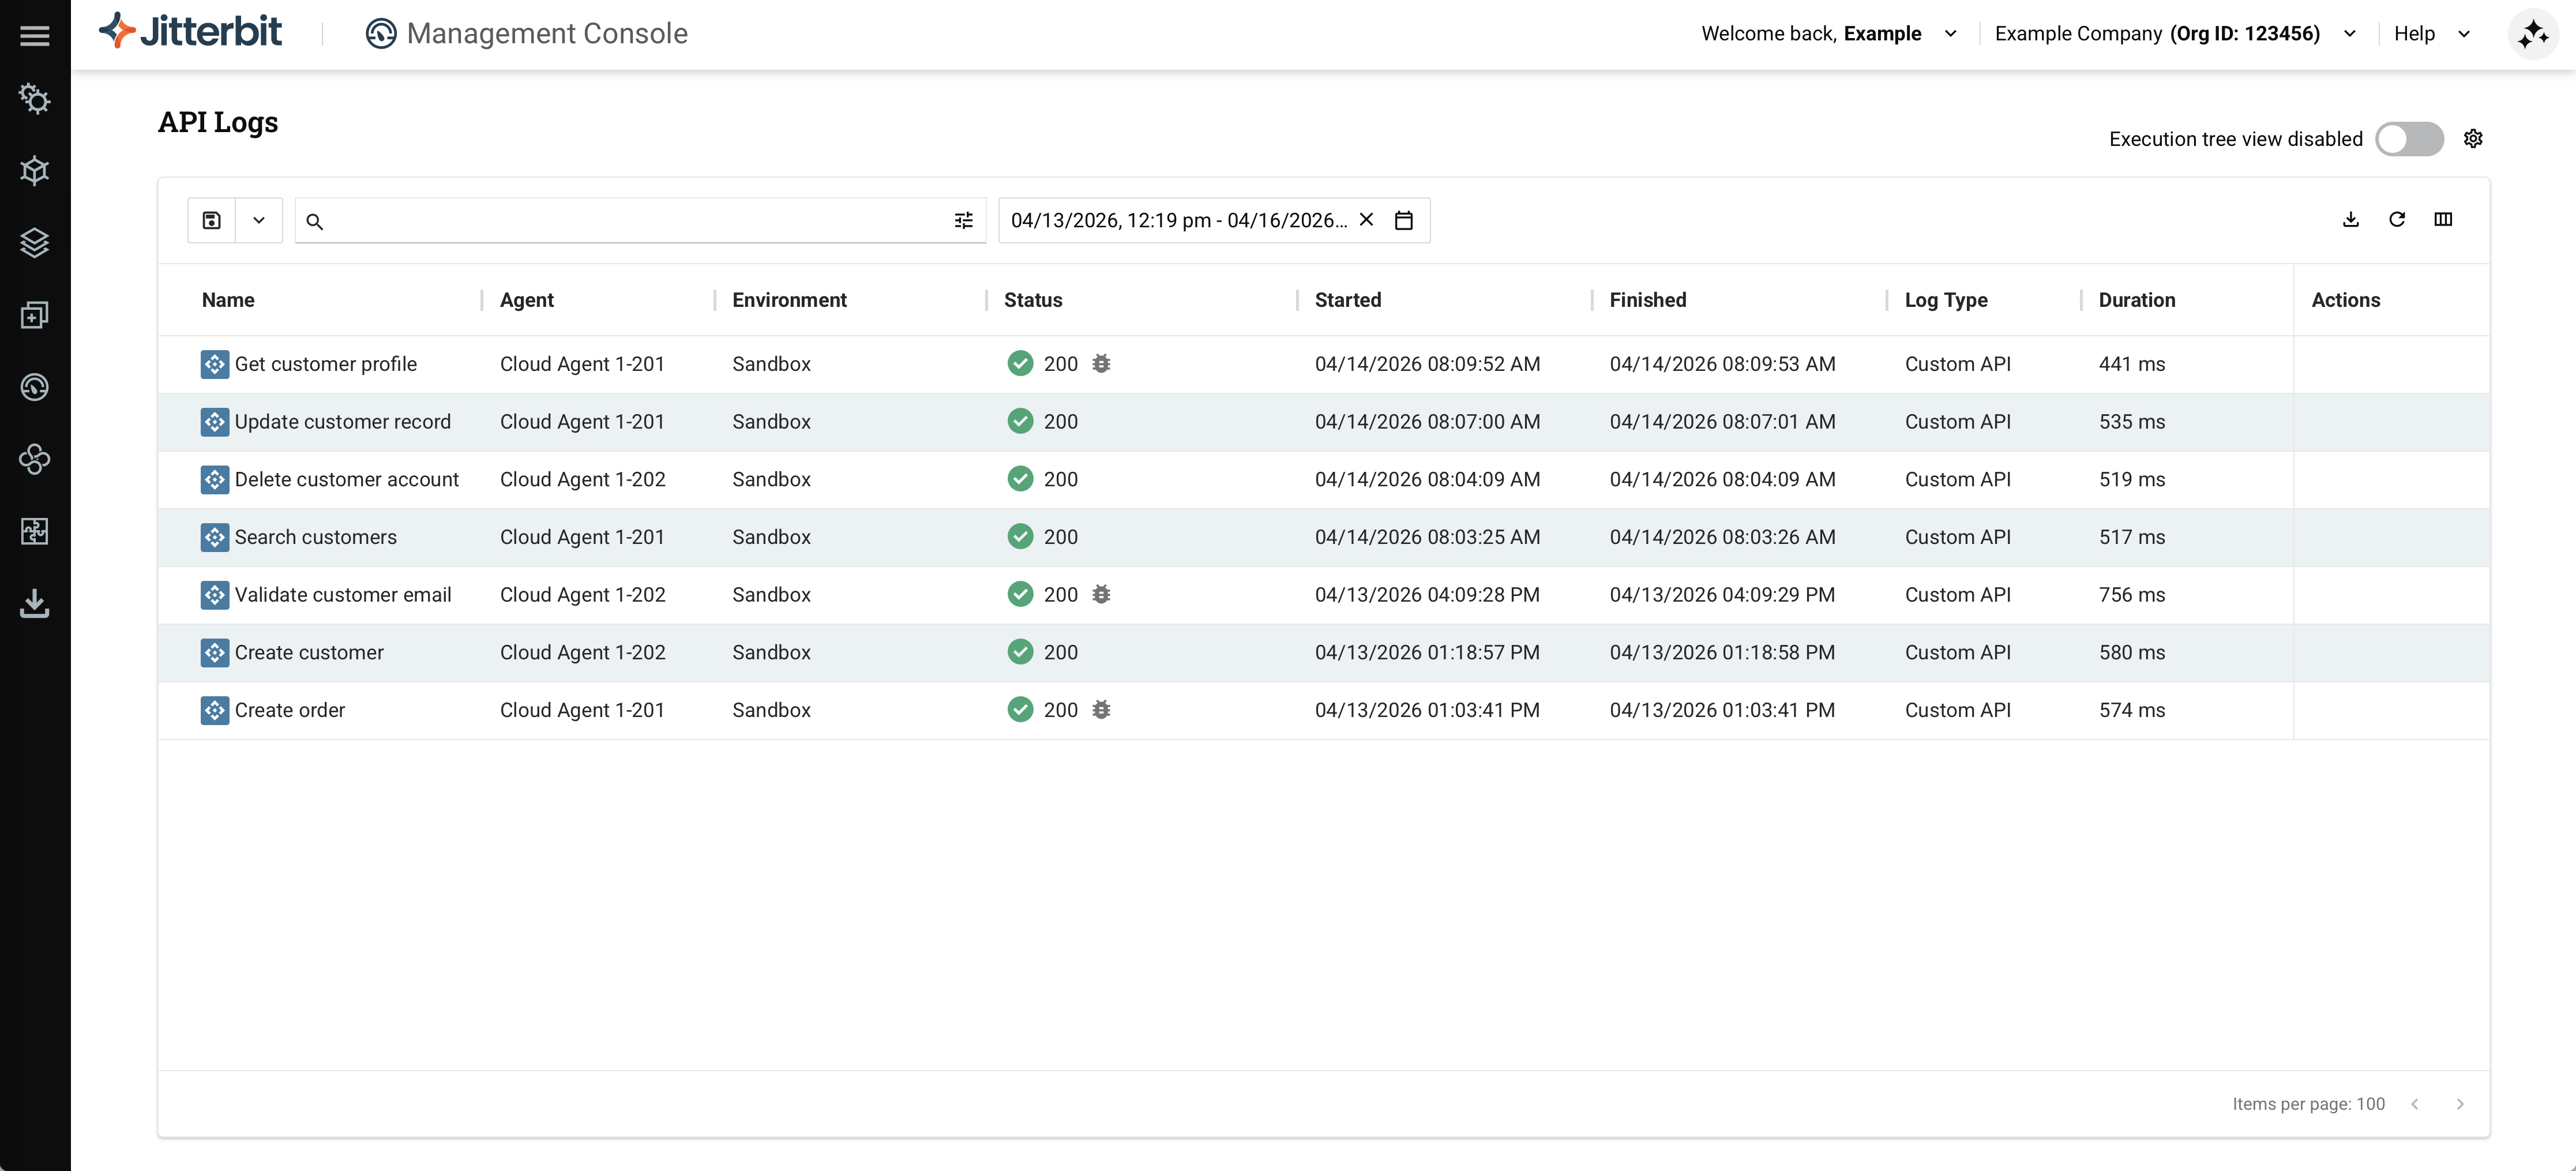
The API Logs page in API Manager displays a table of all API processing logs and debug logs (if debug logging is enabled). Logs are generated for custom, OData, and proxy APIs when they are called through the cloud API gateway or a private API gateway. When an API triggers a Studio operation, the resulting operation logs also appear on the API Logs page in addition to the Studio operation log view and the Management Console Runtime page.
Important
Harmony retains logging data for API logs, API debug logs, and API verbose logs for 30 days from the date the API is consumed.
Note
For details on what information is logged when an API triggers an operation, see API request and response data.
API calls generate four types of logs:
-
API logs: API Manager automatically generates API logs on the API Logs page for each API Manager API call. API logs contain information about the API call, including the timestamp of the API request, the HTTP status code, the request ID, the request method, the request URI, the response time, the source IP of the calling application, the source application, and any log messages.
-
API debug logs: Detailed trace information showing each step of request processing through an API Manager API's service URL. API debug logging is not enabled by default and must be enabled on an individual API Manager API. To enable debug logging, see the Settings tab in custom API configuration, OData API configuration, or proxy API configuration.
-
API verbose logs: Raw request and response data added to the call log when an API request is made, including request and response headers, parameters, and bodies. API verbose logging is not enabled by default and must be enabled on an individual API Manager API. To enable verbose logging, see the Settings tab in custom API configuration, OData API configuration, or proxy API configuration.
-
Private agent operation logs: Information about API calls written to the private agent's
jitterbit.logfile located in thelogdirectory. These logs contain the start of an API call and the time elapsed. Private agent operation logs are configured in the private agent configuration file.
To add additional log information for OData APIs, including SQL data sent to the database, edit the private agent configuration file and set DebugJDML to true.
Access the API Logs page
To access the API Logs page, use the Harmony portal menu to select API Manager > API Logs.
API Logs controls
The API Logs page has controls to filter the data displayed in the log table, set the time range, and manage the table layout.
You can adjust the data displayed by using the saved query controls, search bar, time range menu, and toolbar icons.
Queries
The search bar allows you to filter log entries by the criteria listed below. Enter one or more search terms in the search bar to filter the log entries table.
Note
The API Logs page remembers your last-used filter selections. If you're not seeing expected results, confirm that previously applied filters have been cleared.
Search terms use one of two operators:
=: Returns log entries where the field matches the value.!=: Returns log entries where the field does not match the value.
Wildcard patterns are supported with both operators. Use % or * as the wildcard character:
value%orvalue*: Matches entries where the field starts with the value.abc%dorabc*d: Matches entries where the field starts withabc, ends withd, and has any characters in between.
Wildcard matching is anchored to the start of the field value, so only starts-with (prefix) searches return results. A leading wildcard does not broaden the match: %value% and *value* are both treated as value% (starts with). Searching for text that appears only in the middle or at the end of a field no longer returns results.
These are the supported search criteria:
| Criterion | Valid Search | Invalid Search |
|---|---|---|
| Request ID | requestid=123%;requestid=fI9KRyjM%;requestid!=123%;requestid!=fI9KRyjM%; |
|
| Request URI | requesturi=https://acme2.jitterbit.net%;requesturi=https://acme2.jitterbit.net/defaultUrlPrefix%;requesturi!=https://acme2.jitterbit.net%; |
|
| API Service URL | apiServiceUrl=https://acme2.jitterbit.net/defaultUrlPrefix%;apiServiceUrl=https://acme2.jitterbit.net/defaultUrlPrefix/v1/customers;apiServiceUrl!=https://acme2.jitterbit.net/defaultUrlPrefix%; |
|
| Response Time | responsetime>5;responsetime<5;responsetime>=5;responsetime<=5;responsetime=0; |
responsetime!=5; |
| Source IP | sourceip=14.141%;sourceip!=14.141%; |
|
| Source Application | sourceapp=Mozilla%;sourceapp!=Mozilla%; |
|
| Message | message=REJECT;message=Access Denied;message!=REJECT;message!=Access Denied; |
Note
- Enter the complete API service URL, including the
https://scheme, as the value for theapiServiceUrlcriterion. - The
messagecriterion does not support wildcard characters. Enter the text to match as a phrase; the search returns entries whose message contains that text.
Combine queries
Queries can contain a combination of criteria. Combined search criteria must be separated by a semicolon (;) between each criterion. The = and != operators can be used together in the same search. These are examples of valid combined searches:
message=Access Denied;requesturi=https://acme2.jitterbit.net%;
requestid=yzaccwui%;message=REJECT;
requesturi=https://acme2.jitterbit.net%;responsetime<=2;
responsetime>=5;sourceapp=Mozilla%;
responsetime>=5;sourceip=70.5%;
sourceapp=Mozilla%;message=REJECT;
sourceapp=Mozilla%;responsetime<=1;
sourceip=70.5%;requesturi=https://acme2.jitterbit.net%;
sourceapp!=Mozilla%;message=REJECT;
sourceapp!=Mozilla%;responsetime<=2;
message!=Access Denied;requesturi=https://acme2.jitterbit.net%;
sourceip!=70.5%;sourceapp=Mozilla%;
Saved queries
Queries can be saved and reused, then edited or deleted:
-
Save a query: Click Save query. A query form opens:
- Name: Enter a name for the saved query.
- Query: The current search terms are pre-populated. Edit or add query terms using the same syntax as the search bar. Click the field to show a list of available search terms, or type a term followed by a semicolon.
Click Save to save the query.
-
Use a saved query: Click Saved queries to open the list of saved queries, then click a query to apply it. The search terms are applied to the search bar and the results update automatically.
Note
Date range values from a saved query are applied to the time period selector, not the search bar.
-
Edit a saved query: Click Saved queries, then click the Edit icon for the query you want to edit. Update the name or query terms, then click Save.
-
Delete a saved query: Click Saved queries, then click the Delete icon for the query you want to delete. Confirm the deletion when prompted.
Time period selector
The time period selector displays the currently selected time range (for example, Last 24 hours) and allows you to adjust the API log data time frame:

Click the time period selector to open a dialog with two tabs: Relative and Absolute.
Relative tab
The Relative tab provides preset time ranges and a custom relative time period selector:
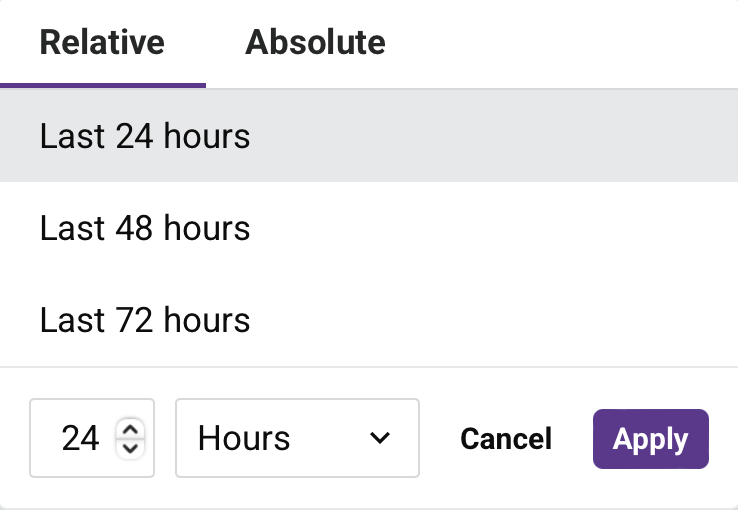
Select one of the preset time ranges:
-
Last 24 hours: Displays API log data for the past 24 hours.
-
Last 48 hours: Displays API log data for the past 48 hours.
-
Last 72 hours: Displays API log data for the past 72 hours.
To create a custom relative time period, use the controls at the bottom of the dialog:
-
Number field: Enter the number of time units (for example,
1,7,30). -
Unit dropdown: Select the time unit from Minutes, Hours, Days, Weeks, or Months.
-
Cancel: Close the dialog without applying changes.
-
Apply: Apply the selected time range and close the dialog.
Absolute tab
The Absolute tab allows you to select a specific date and time range within the past 90 days. Dates outside this range are not selectable. API logs are retained for 30 days, so results are available only for dates within that period:
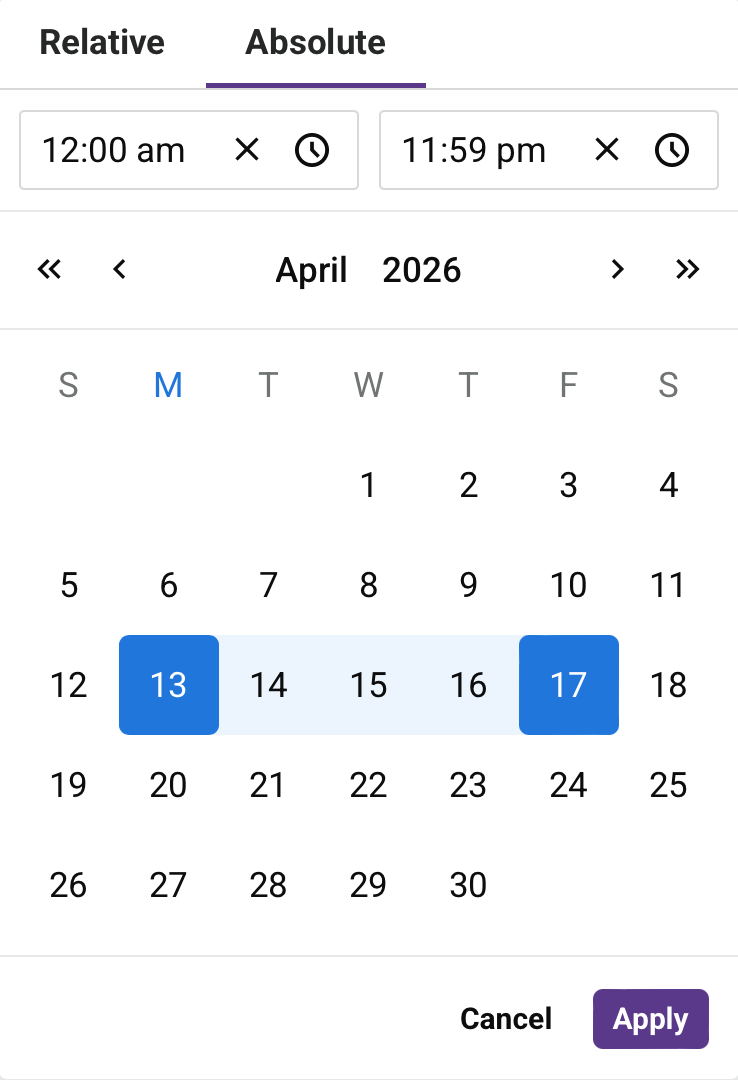
The selected date range displays at the top of the dialog in the format MM/DD/YYYY, HH:mm am/pm - MM/DD/YYYY, HH:mm am/pm.
Configure the date and time range using the following controls:
-
Start time field: Displays the start time for the range. Click to clear, or click to adjust the time.
-
End time field: Displays the end time for the range. Click to clear, or click to adjust the time.
-
Calendar picker: Use the calendar to select start and end dates. Navigate between months using the left and right arrows.
-
Cancel: Close the dialog without applying changes.
-
Apply: Apply the selected date and time range and close the dialog.
Additional controls
Additional controls appear on the right side of the toolbar:
-
Download as CSV: Click to open the Download logs dialog. The export has the following characteristics:
- Scope: The export uses the applied filters and search criteria, reflecting all matching log entries. This is equivalent to the full result set shown across all pages of the table.
- Hierarchy: The export preserves the parent-child hierarchy of API and operation log entries, keeping related chains contiguous.
- Order: Records are ordered by parent Started time (descending), with child operation records ordered by execution sequence (ascending).
- Time zone: The Started and Finished timestamps use your browser's local time zone.
- Packaging: When the export spans multiple files, all files are packaged in a single ZIP archive for download.
The dialog contains the following option:
- Include messages: Select to include full log messages in the export. This option is unselected by default. Including messages may significantly increase file size and generation time.
Click Download to start the export, or Cancel to dismiss.
-
Refresh: Click to refresh the log data based on the applied filters and search criteria.
-
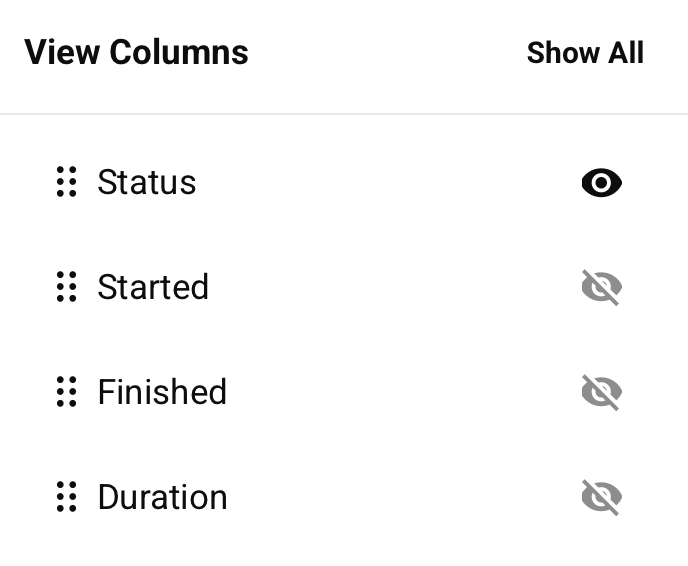
Filter columns: Click to change the visibility and order of columns. The Columns side drawer opens with the following controls:
-
Search: Enter part or all of a column name to reduce the list to those matching the text.
-
Show All: Make all columns visible.
-
Move: Drag and drop to change the position of the column relative to others.
-
Visible: The column is shown in the table. Click to hide it.
-
Hidden: The column is not shown in the table. Click to show it.
-
Save: Save any changes to the columns.
-
Cancel: Close the columns editor without saving changes.
-
Page settings
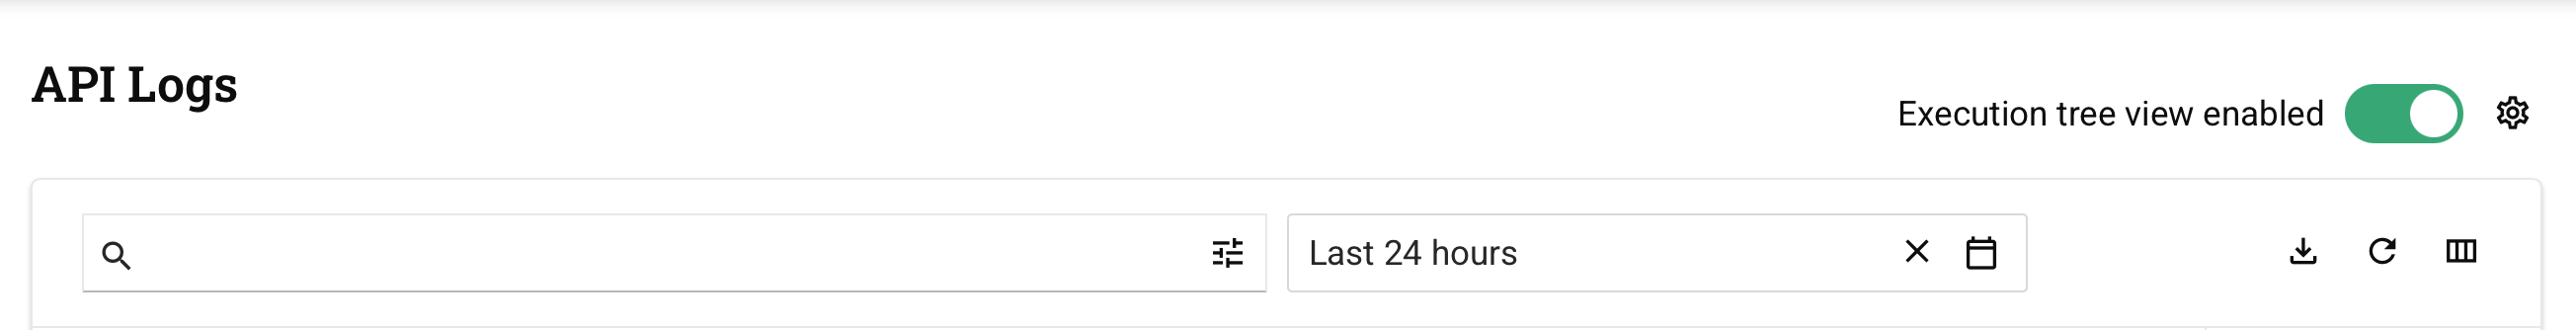
The top-right corner of the page contains the Execution tree view toggle and the Settings icon:

-
Execution tree view: Toggle to control how search results display the parent-child hierarchy of log entries. When enabled, search results include the full execution chain for each matching entry: if the match is an API log entry, all its child operation entries are shown; if the match is an operation entry, its parent API log entry and any sibling or child operations are also shown. When disabled, only the entries directly matching the search criteria are shown, without parents or children.
-
Settings: Click to open the Settings drawer. Select an auto refresh interval, one of Never (the default), 1 minute, 5 minutes, 15 minutes, or 30 minutes, then click Save.
Log entries table
Each row in the API Logs table displays logging data for an API call or an operation triggered by that call.
Tip
To change the visibility and order of columns, use Filter columns, described in additional controls.
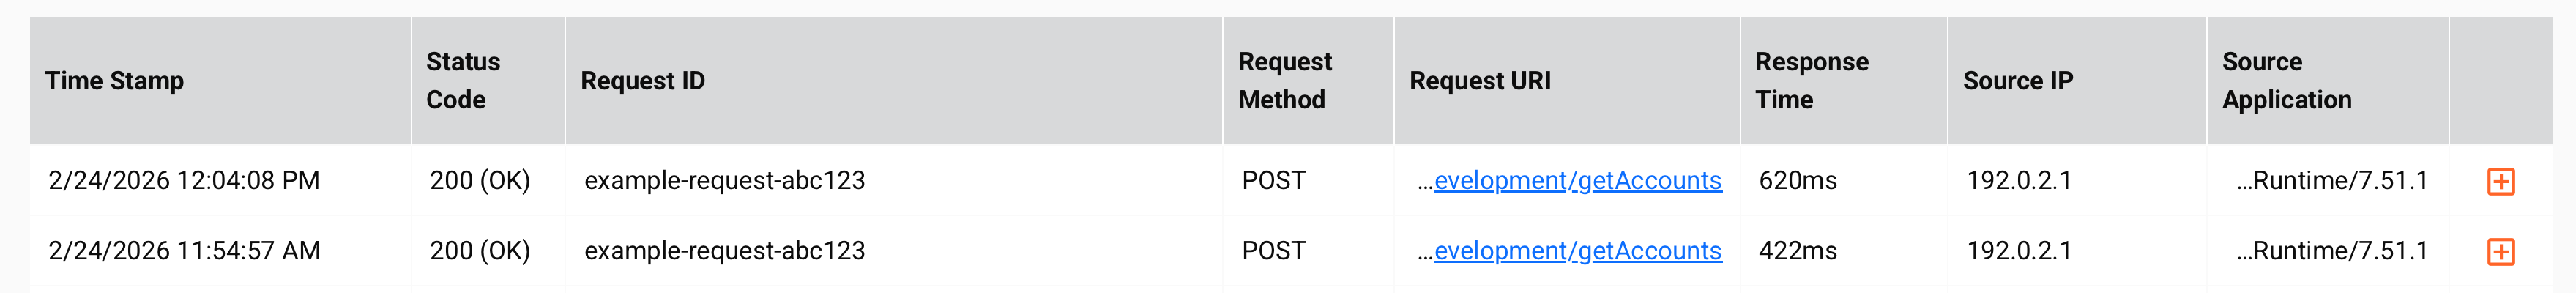
The following columns are available:
| Column | Description | Applies to |
|---|---|---|
| Name | The name of the API or operation associated with the log entry. | All |
| Log Type | The type of log entry: Custom API, Proxy API, or OData API for API log entries, or Operation for operation log entries. Operation log entries appear automatically when an API call triggers a Studio operation. No additional configuration is required. | All |
| Environment | The name of the environment where the API is deployed. | All |
| Status | The status of the log entry. For API log entries, this is the HTTP status code (see w3.org status code definitions). For Operation log entries, this is the operation status. | All |
| Started | The timestamp when the API request was received or the operation began running. Times are displayed in your browser's time zone. | All |
| Finished | The timestamp when the API call or operation completed. Times are displayed in your browser's time zone. This field is blank while the API call or operation is still running. | All |
| Duration | The time elapsed between Started and Finished. This field is blank while the API call or operation is still running. | All |
| ID | The unique identifier for the log entry. | All |
| API Service URL | The complete URL for calling the API, including the base URL, service root, version, and any path parameters. | API only |
| API Version | The version number of the API. | API only |
| Request Method | The HTTP method used for the API call. Possible values include GET, POST, PUT, DELETE, PATCH, and MERGE. | API only |
| Source IP | The IP address of the client application or server that made the API request. | API only |
| Source Application | The application or browser that made the API request. | API only |
| API Gateway | The domain name of the cloud API gateway or private API gateway that processed the request. | API only |
| Gateway Type | The type of API gateway that processed the request, either Public (cloud API gateway) or Private (private API gateway). | API only |
| Auth Type | The type of authentication used by the security profile assigned to the API. | API only |
| Agent | The name of the agent that processed the operation. | Operation only |
| Project | The name of the project associated with the log entry. | Operation only |
| Root Operation Instance GUID | The globally unique identifier (GUID) of the root operation instance. | Operation only |
| Operation ID | The unique identifier of the operation triggered by the API call. | Operation only |
Note
Log Type in this table refers to the category of the log entry, not to the API log types (API logs, debug logs, verbose logs, private agent operation logs) described in the Introduction.
Hover over a log entry to reveal available actions. Actions differ by log type:
For Custom API, Proxy API, and OData API log entries:
- View: Open the API log details.
- Open API: Open the API in API Manager.
For Operation log entries:
- View: Open the API log details.
-
Cancel operation: Enabled for operations that are in Submitted, Received, Pending, or Running status. Cancel operation sends a request to the agent to stop the operation. Once clicked, the Cancel Requested status is displayed next to the real-time operation status.
Note
Sending a cancellation request does not guarantee the operation will be canceled. Operations that have a Cancel Requested status may still run, depending on the current execution state of the agent.
-
Go to operation: Open the project in Studio, and select the operation. This action is available only for Studio operations, not Design Studio operations.
When there are more than 100 log entries, they are split into pages of 100 each. Use the Previous Page and Next Page navigation buttons at the bottom of the table to move between pages.
API log details
To view additional details or debug logs (if enabled) for a log entry, click the entry in the table. A drawer opens at the bottom of the page with the following tabs, depending on the log type:
- Custom API, Proxy API, and OData API log entries: Messages and Debug Logging.
- Operation log entries: Messages, Activity Logs, and Debug Logging.
The drawer is titled Messages and Logs and displays the name, status, started time, finished time, and duration for the selected log entry.
Messages tab
The Messages tab content differs depending on the log type of the selected entry.
API log entries
When a Custom API, Proxy API, or OData API log entry is selected, the Messages tab displays details about the API call in the following collapsible sections: API information, Call information, Call log, and API Payload (when enabled).
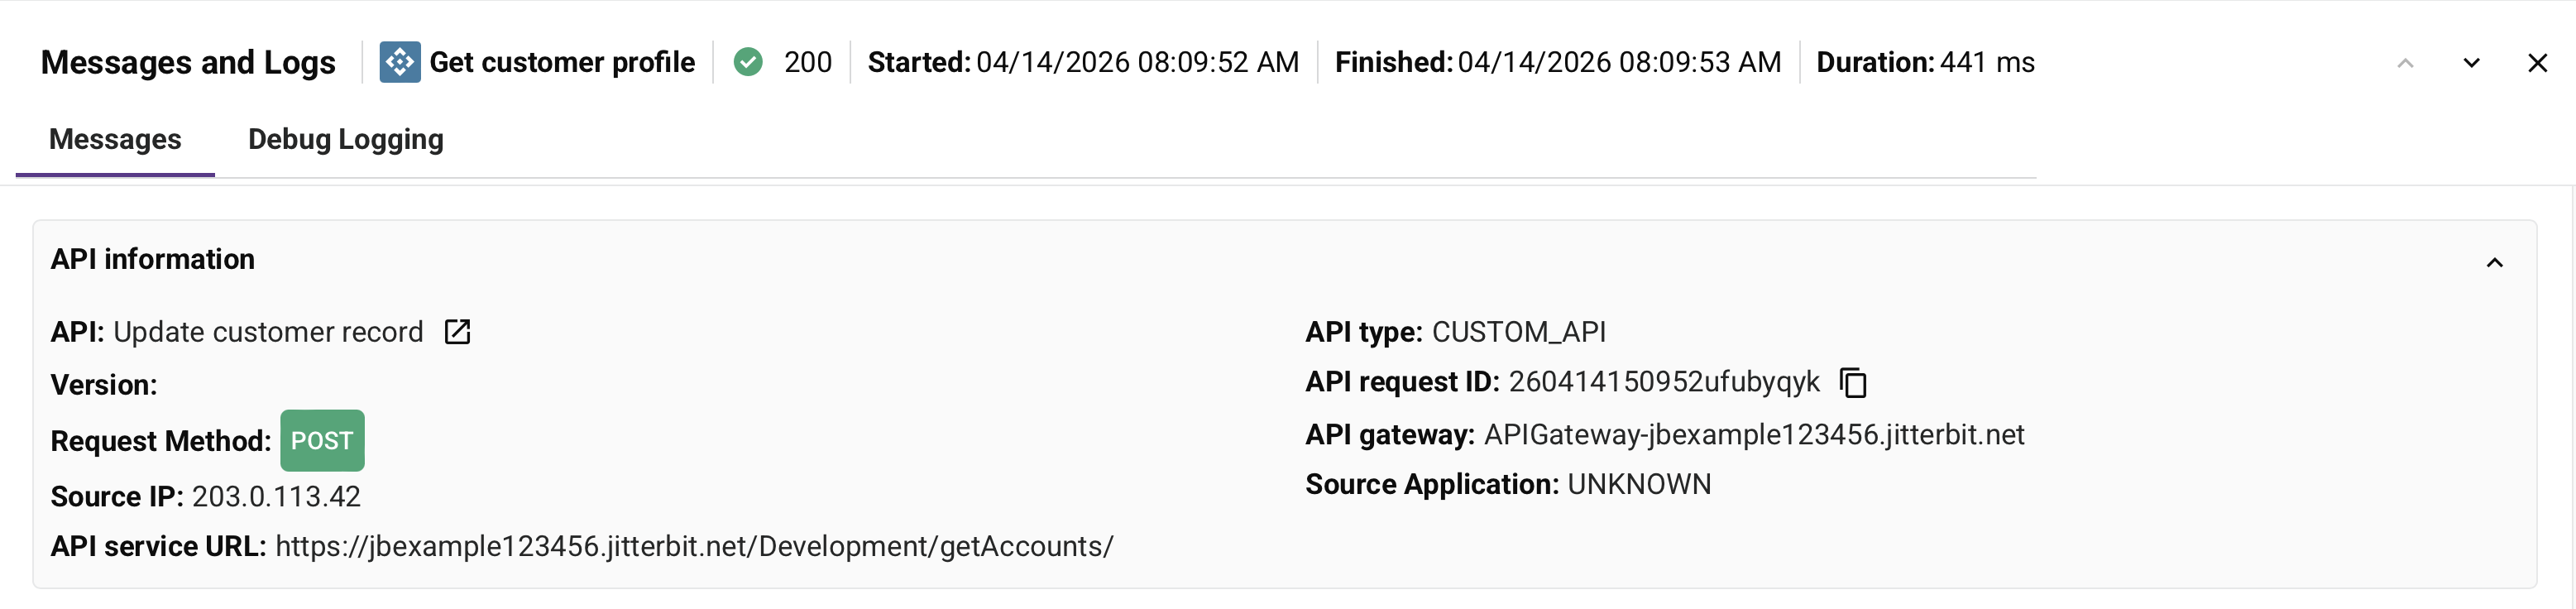
API information
The API information section displays the following details:
-
API: The name of the API that triggered the operation. Click to open the API configuration in a new tab in API Manager.
-
Version: The version number of the API.
-
API type: The type of the API, one of the following:
- CUSTOM_API: A custom API created in API Manager.
- ODATA: An OData API created in API Manager.
-
Request Method: The HTTP method used for the API call. Possible values include GET, POST, PUT, DELETE, PATCH, and MERGE.
-
API request ID: A unique identifier for the API request. You can use this ID to correlate logs across different systems and to search for specific requests. Click to copy the value.
-
Source IP: The IP address of the client application or server that made the API request.
-
API gateway: The API gateway that processed the request. This field shows the domain name of either the cloud API gateway or private API gateway that handled the API call.
-
API service URL: The complete URL for calling the API, including the base URL, service root, version, and any path parameters. This is the full API service URL as consumed by the client.
-
Source Application: The application or browser that made the API request.
Call information
The Call information section displays the HTTP request headers sent with the API call under a Request headers label. Each header is displayed as a key-value pair, such as accept, accept_encoding, content_length, fulluri, host, user_agent, and forwarding headers.
Call log
The Call log section displays system-level log messages generated during processing of the API request. Click to copy the log to your clipboard.
API Payload
The API Payload section displays the request and response payload data for the API call. This section is visible when one or both of the following are enabled in the API's Settings tab: Enable debug mode until or Show Request & Response Payloads in Logs.
The section is split into two panels:
-
Request body: The payload sent with the API request.
-
Response body: The payload returned by the API. If the response payload exceeds the display limit, it is shown with a
(Truncated)label.
Each panel provides the following controls:
-
Search: Search the payload for a specific string.
-
Copy: Copy the payload to your clipboard.
-
Download: Download the payload as a file.
Operation log entries
When an Operation log entry is selected, the Messages tab displays the following:
-
Source Records: When using an FTP or Database activity as a source, the count of records that have been read from the source system is displayed. For other connectors, the count reads
0regardless of the number of source records. -
Target Records: When using an FTP or Database activity as a target, the count of records that have been posted to the target system is displayed. For other connectors, the count reads
0regardless of the number of target records. -
Message: Log details for the operation, including any of the following:
- System-generated messages indicating that the operation completed without error.
- Information and warning messages returned by either the source or target systems.
- Validation warnings returned by the Jitterbit transformation, validation, and scripting services.
- User-defined messages generated by the Invoke Operation tool (when Raise error if operation fails is enabled) or the
WriteToOperationLog()function.
Log messages are displayed as individual blocks labeled by message type (for example, Message, Error, or Fatal Error processing operation). Each block provides to copy or to download its content.
Note
- Dates and times in log messages appear in their original format from the source and aren't converted to local browser time.
- Log messages that exceed ~100 KB in size (~99,000 characters) are truncated, denoted with
message truncatedappearing at the end of the log.
-
Messages logged in pre-transformation scripts: Messages generated during pre-transformation script execution. Click to copy or to download.
Activity Logs tab
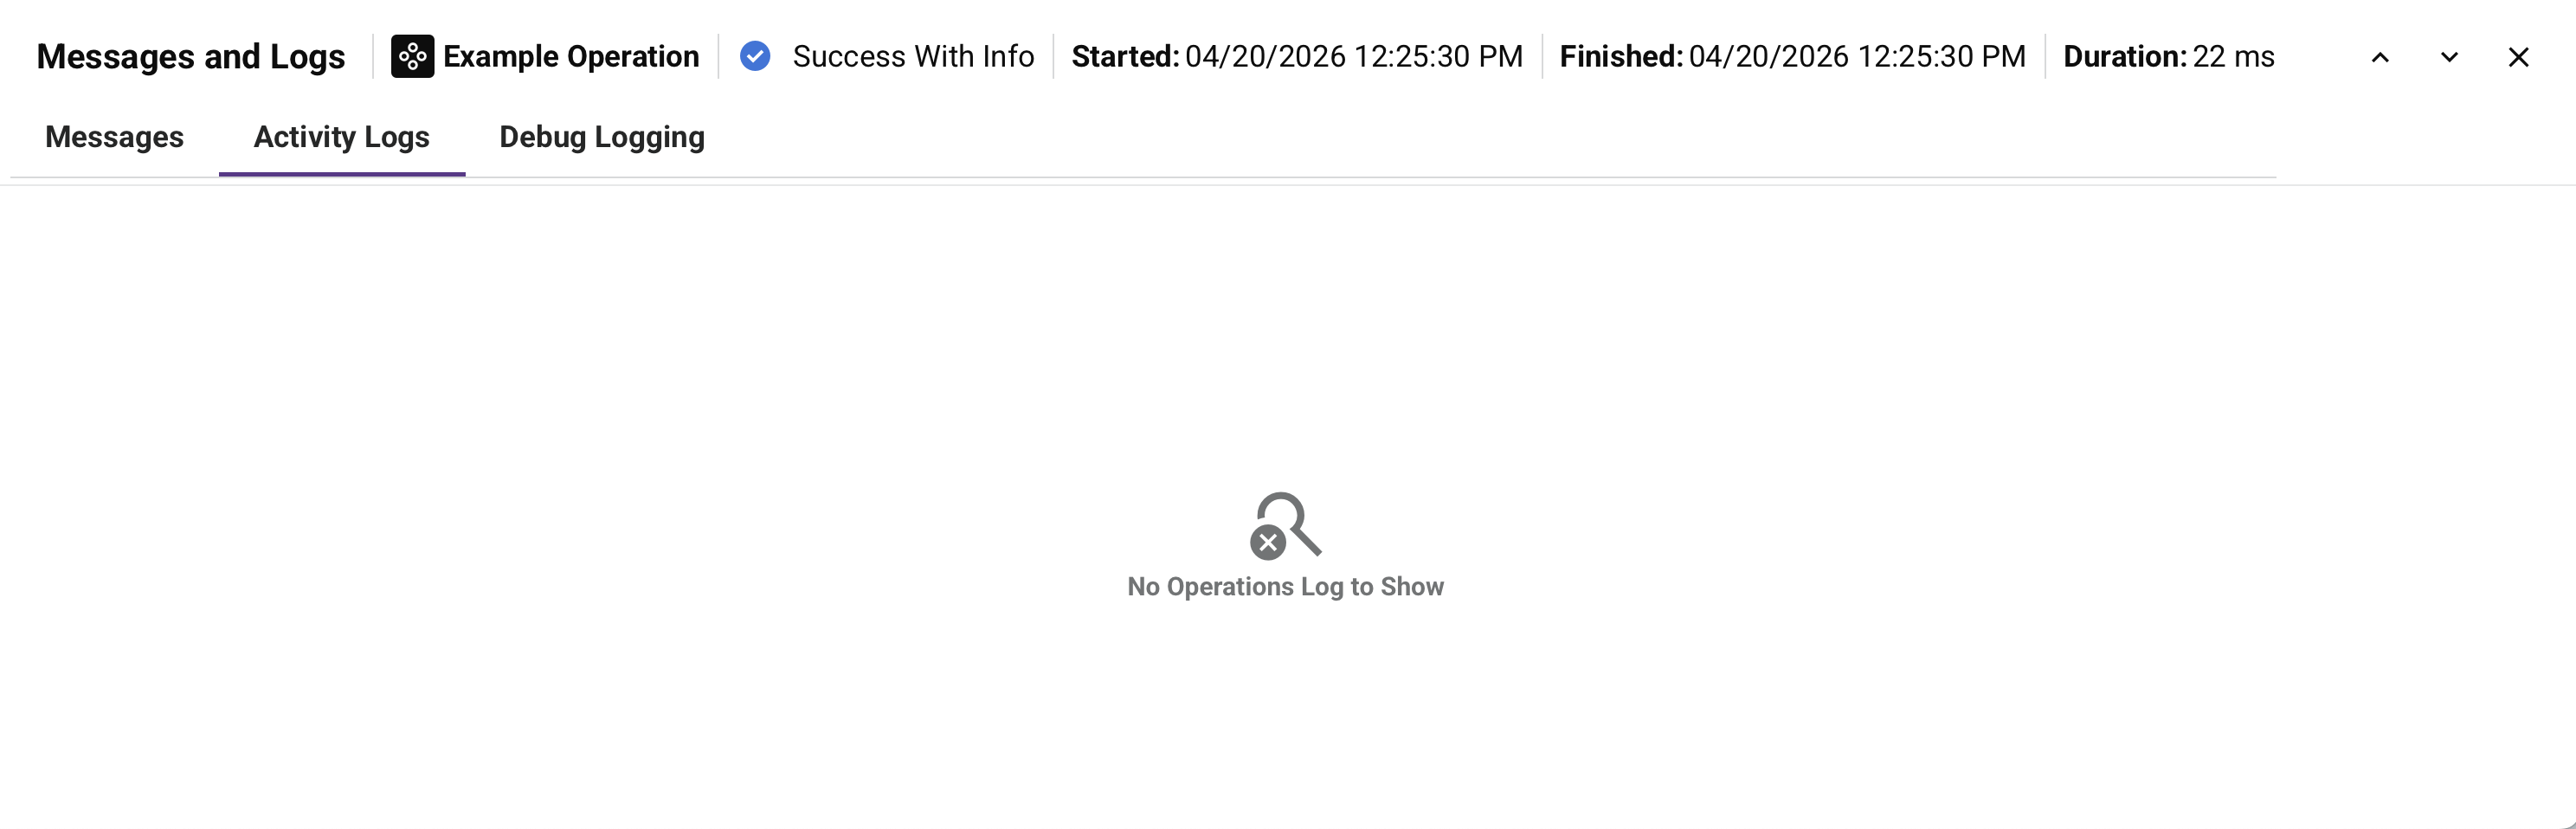
The Activity Logs tab contains links to success or failure files created by Salesforce, Salesforce Service Cloud, or ServiceMax activities running on a private agent. Files are in CSV format. Click a link to download.
Activity log files are automatically deleted after 14 days by the private agent's file cleanup service. You can change this behavior in the [ResultFiles] section of the private agent jitterbit.conf file, or by changing the file cleanup service rules.
Activity log downloads are disabled for cloud agents. You may see download links, but attempting to download generates an error message.
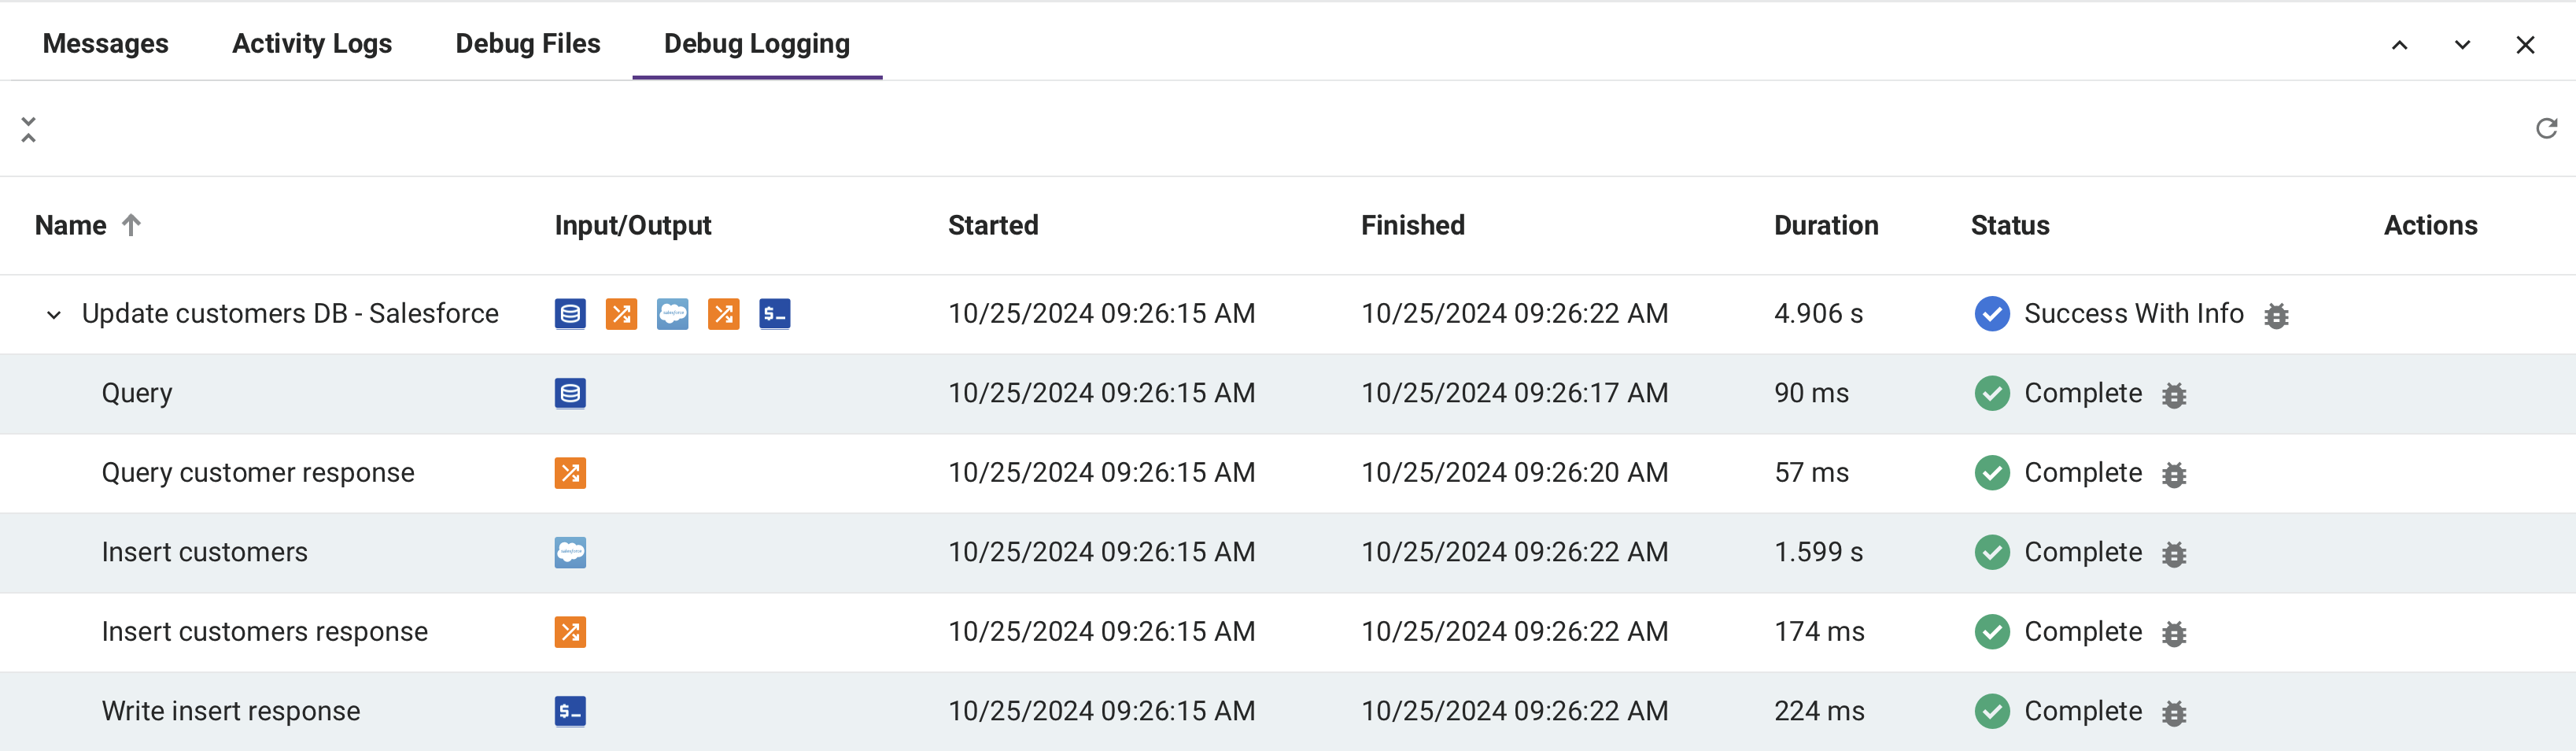
Debug Logging tab
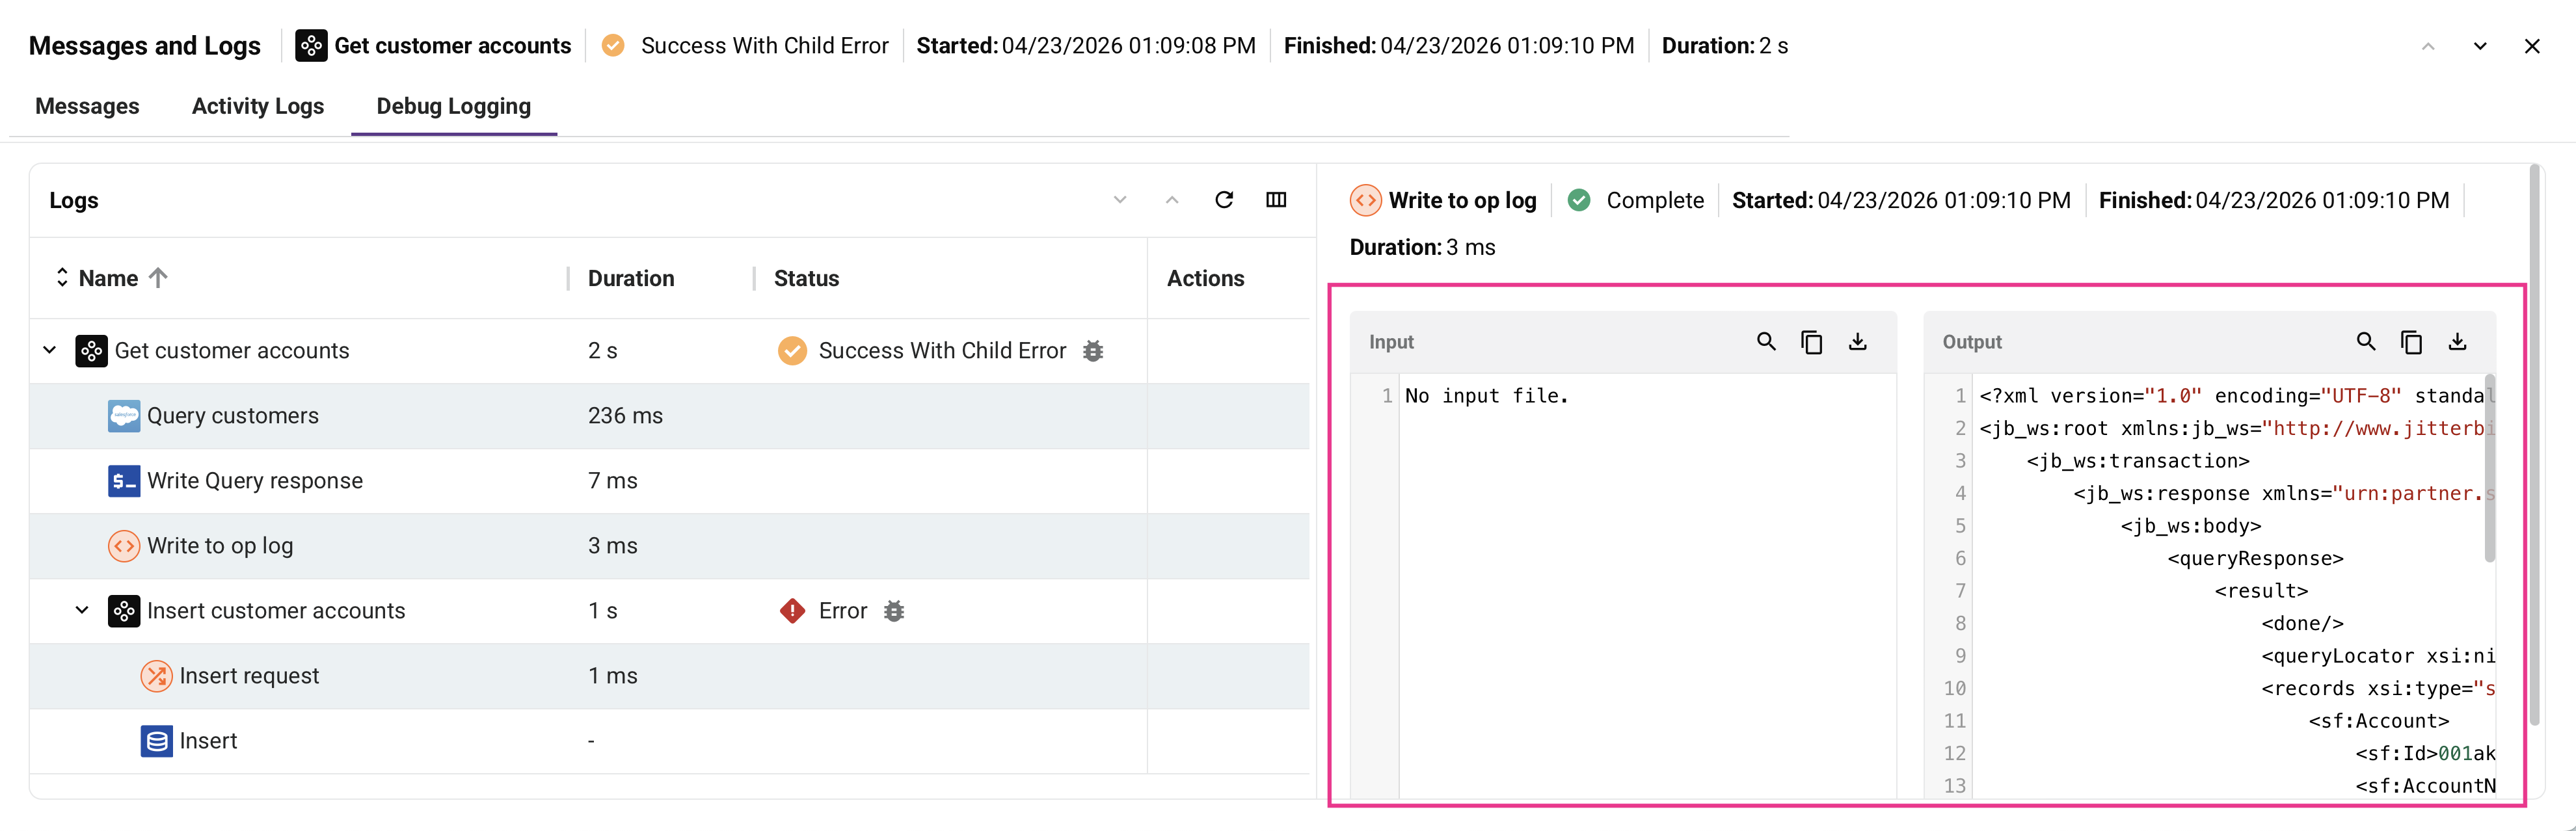
When debug logging is enabled at the operation level (for cloud agents or for private agents) and the operation was run on a 10.48 or later agent, this tab shows the details of a Studio operation's full execution hierarchy. The operation log view displays a split view with operation logs in the left panel and detailed log information for the selected operation in the right panel. The view uses the selected table controls to filter results. If operations are chained with operation actions or the RunOperation function, those operations are listed under the parent operation.
When operation debug logging is enabled, this tab may also display component input and output data and API request and response data (when the operation is triggered by an API Manager API). Request and response payload is included only when Show Request & Response Payloads in Logs is also enabled in the API's Settings tab.
Parent operations (and any child operations beneath them) are sorted in ascending order by Started. The table can be sorted (for top-level operations only) by Name, Started, Finished, Duration, or Status by clicking the respective header row.
When you open the operation log view, the first operation log in the list is selected by default. The detailed log information for this operation appears in the right panel.
-
Name: The name of the operation or operation step. The carets, which can be used to expand or collapse additional rows, are shown on parent operations and on operations for which component input and output data are available:
- Parent operations: When a parent operation is expanded, additional rows for its child operations appear in the order in which they were executed. By default, all parent operations are expanded. Use the collapse list or expand list icons to collapse or expand all parent operations.
-
Started: The date and time the operation or operation step began running, displayed as the local browser time.
-
Finished: The date and time the operation or operation step stopped running, displayed as the local browser time. This field is blank while the operation or operation step is still running.
-
Duration: The time elapsed between Started and Finished, reported in seconds for operations and in milliseconds for operation steps. This field is blank while the operation or operation step is still running.
-
Status: The status of the operation or operation step. For a complete list of possible statuses, see Operation details table.
-
Actions: These actions are available for operations (not operation steps):
-
Cancel operation: Enabled for operations that are in Submitted, Received, Pending, or Running status. Cancel operation sends a request to the agent to stop the operation. Once clicked, the Cancel Requested status is displayed next to the real-time operation status.
Note
Sending a cancellation request does not guarantee the operation will be canceled. Operations that have a Cancel Requested status may still run, depending on the current execution state of the agent.
-
Go to operation: Open the project in Studio, and select the operation.
-
-
Refresh: Click to refresh the list of operation logs.
-
Filter Columns: Click to open a drawer that allows you to reorder the columns or adjust their visibility in the operation list panel:
-
Show All: Make all columns visible.
-
Move: Drag and drop to change the position of the column relative to others.
-
Hide: The column is visible. Click to hide it.
-
Show: The column is hidden. Click to show it.
-
-
Resize columns: Drag a column's Resize bar to resize it.
-
Operation log: To show or hide a log for an individual operation, click an operation from the list.
-
Log messages: Log messages include the log details for the selected operation. Whether log messages are displayed depends on the current user's permissions and access levels and whether cloud logging is enabled. For more information, see Messages tab earlier on this page.
Note
Dates and times displayed within the log messages themselves are not converted to local browser time, but are reported in their original format from the source of the log message.
-
Copy: Copies the log data to your clipboard.
- Download: Downloads the log messages as a text file.
- Show / hide: Shows or hides the log messages.
-
Component input and output data
Component input and output data is generated when an operation has operation debug logging enabled at the operation level (for cloud agents or for private agents) and the operation was run on a 10.48 or later agent.
Note
The generation of component input and output data is unaffected by the agent group setting Cloud logging enabled. Component input and output data will be logged to the Harmony cloud even if cloud logging is disabled.
To disable generation of component input and output data in a private agent group, in the private agent configuration file under the [VerboseLogging] section, set verbose.logging.enable=false.
Warning
When component input and output data are generated, all request and response data for that operation are logged to the Harmony cloud and remain there for 30 days. Be aware that personally identifiable information (PII) and sensitive data such as credentials provided in a request payload will be visible in clear text in the input and output data within the Harmony cloud logs.
When component input and output data is present, a graphical representation of the operation or operation step is displayed in the operation list panel.
Icons for activities and transformations used as operation steps are displayed. You can click an operation step to show or hide the component input and output data for that individual operation step. Each input and output log entry is limited to 100 MB. If the data for an individual input or output log entry exceeds 100 MB, no data will be displayed.
- Search: Search the data for the entered text.
- Copy: Copies the log data to your clipboard.
- Download: Downloads the input or output data as a file in the appropriate data format. The file is named with the operation step name followed by
_inputor_outputas appropriate.
API request and response data
When an operation is triggered by an API Manager custom API or OData API, the information displayed in the Messages tab log entry details depends on which settings are enabled. API information, call information, and basic call log data are always included. indicates the information type is included; indicates it is not:
| Settings enabled | API information | Call information | Raw request and response data | Request/response payloads | Operation log entries |
|---|---|---|---|---|---|
| None (default) | |||||
| Verbose logging (custom API, OData API, or proxy API settings) | |||||
| Show Request & Response Payloads in Logs (custom API or OData API settings) | |||||
| Enable debug mode until (custom API, OData API, or proxy API settings) — overrides Verbose logging and Show Request & Response Payloads in Logs | |||||
| Operation debug logging (cloud agents or private agents) Also logs to the Debug Logging tab |
API Manager Log Service API (Beta)
As an alternative to downloading an API log file by clicking Download as CSV, you can retrieve API logs programmatically using the API Manager Log Service API (Beta).