Analytics page in Jitterbit API Manager
Introduction
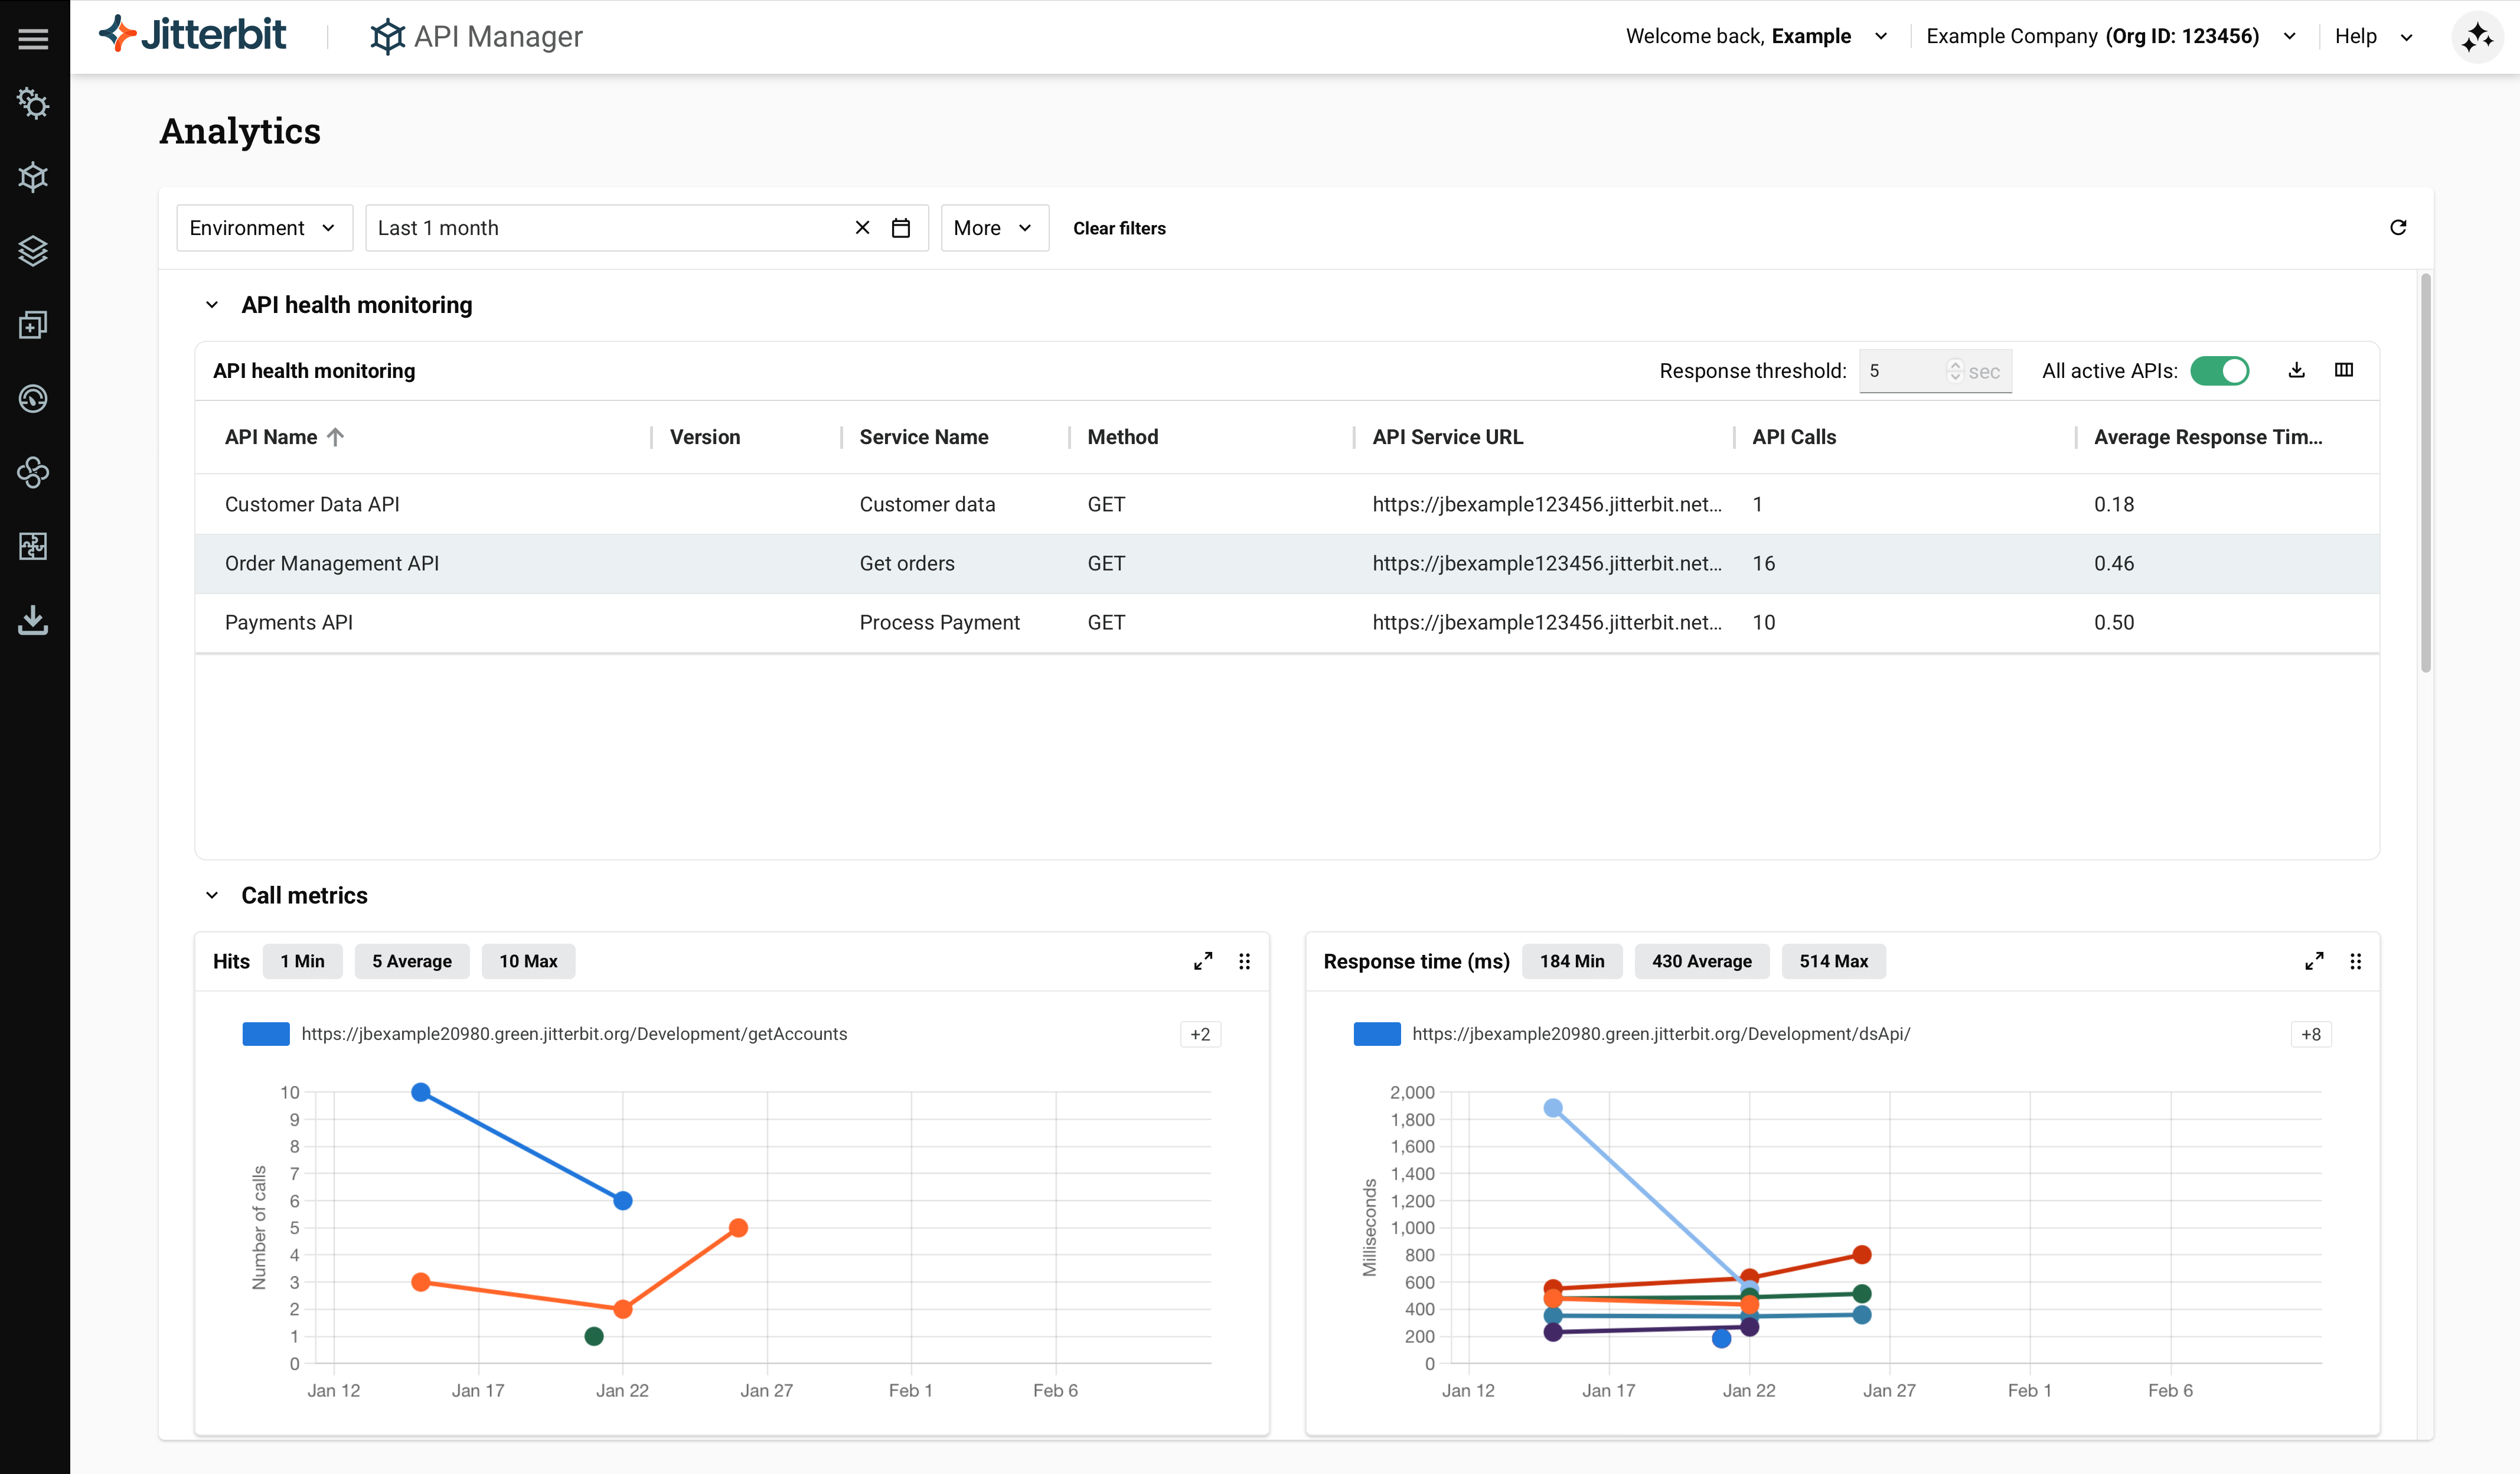
The Analytics page in API Manager shows consumption and performance metrics for custom APIs, OData APIs, and proxy APIs. The data appears in multiple charts.
Updated Analytics interface
The Analytics page has been updated with a new interface. This update is being rolled out in phases, so different organizations may see the new interface at different times. This documentation reflects the new interface. If you do not yet see these changes in your organization, refer to the legacy Analytics documentation for the previous interface.
Important
API metrics are available on the Analytics page for 30 days from the date the API is consumed.
Note
You must have already published an API and executed at least one API request to see API analytics data.
For more information on configuring and executing an API, see these resources:
Access the Analytics page
To access the Analytics page, use the Harmony portal menu to select API Manager > Analytics.
Analytics page controls
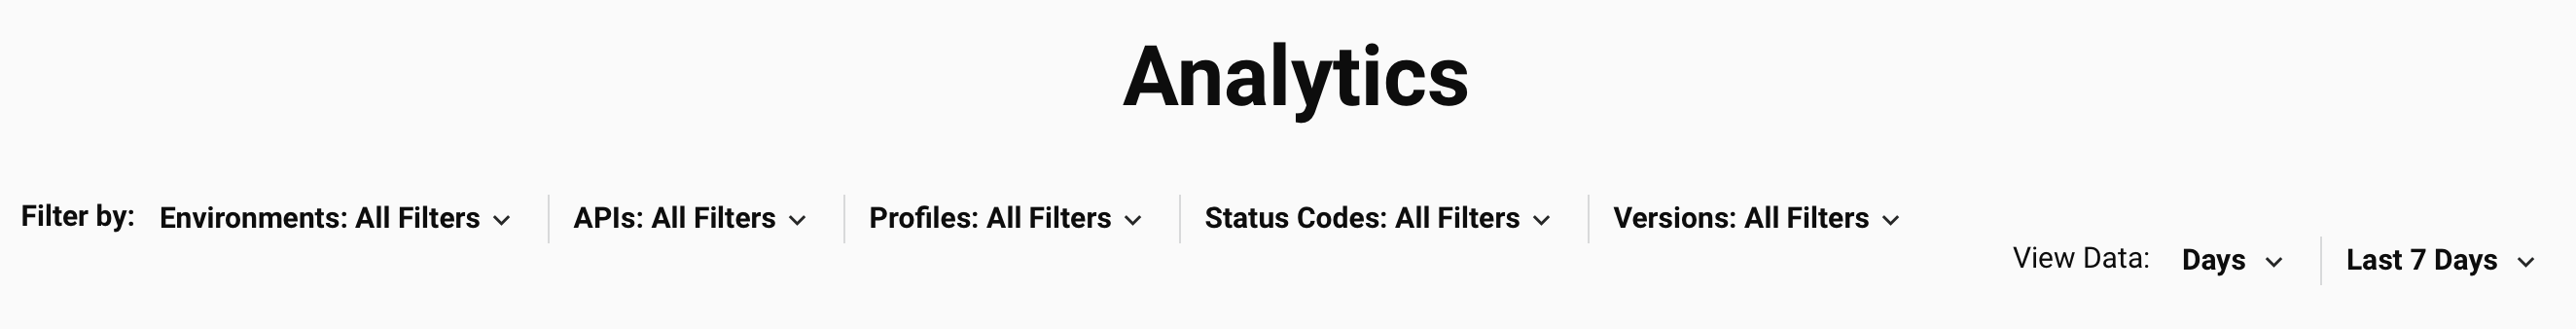
The Analytics page has controls to filter the data displayed in charts, set the time period, and manage chart layout.
You can adjust the data each chart displays, as well as the time frame and scale of the chart, using the filter dropdowns and time period selector.
Filter dropdowns
The filter dropdowns allow you to display specific criteria across any combination of environments, APIs, profiles, status codes, and versions as needed.
Each filter displays a dropdown list of criteria from which you can select one or multiple criteria using checkboxes. When filters are applied to a dropdown, a count badge appears next to the dropdown label indicating the number of active filters.
Note
Filter selections are not retained when you leave the Analytics page.
These are the available criteria to filter by:
-
Environment: Use the dropdown to select environments where the APIs are located. When no filters are selected, all APIs in environments within the organization to which you have access are displayed.
-
APIs: Use the dropdown to select published APIs within the organization. Each API is listed by name only. When no filters are selected, all APIs in the organization to which you have access are displayed. Because filtering matches on the API name, selecting an API can return results for multiple APIs that share the same name across different versions or environments. Use the Environment and Version filters to narrow the results.
Note
Previously published APIs that become unpublished will not appear in the APIs dropdown. API logs for these APIs will be present on the API Logs page, but cannot be filtered.
-
Version: Use the dropdown to select the version number of the APIs. When no filters are selected, all versions of the APIs in the organization to which you have access are displayed.
-
Methods: Use the dropdown to select HTTP methods. When no filters are selected, all HTTP methods for the APIs in the organization to which you have access are displayed.
-
Status Codes: Use the dropdown to select the HTTP response status code groups, selecting from Success (2xx), Redirections (3xx), Client Errors (4xx), and Server Errors (5xx). When no filters are selected, all HTTP response status codes for APIs in the environments to which you have access are displayed. For more information on status codes, see w3.org status code definitions.
-
Profiles: Use the dropdown to select the security profiles to filter the logs by. The dropdown displays security profiles created within the organization.
-
Clear filters: Click to remove all applied filters across all dropdowns. To add or remove individual filter items, click the checkbox next to the item name within the dropdown. To clear all selections for a specific filter dropdown, click next to the filter count badge.
-
Refresh: Click the refresh icon to reload the analytics data based on the applied filters and search criteria.
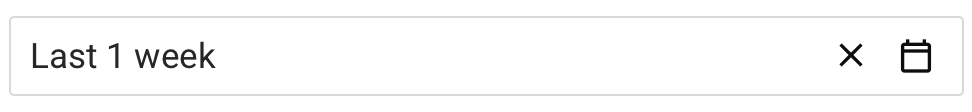
Time period selector
The time period selector displays the currently selected time range (for example, Last 1 week) and allows you to adjust the analytics data time frame:
Click the time period selector to open a dialog with two tabs: Relative and Absolute.
Relative tab
The Relative tab provides preset time ranges and a custom relative time period selector:
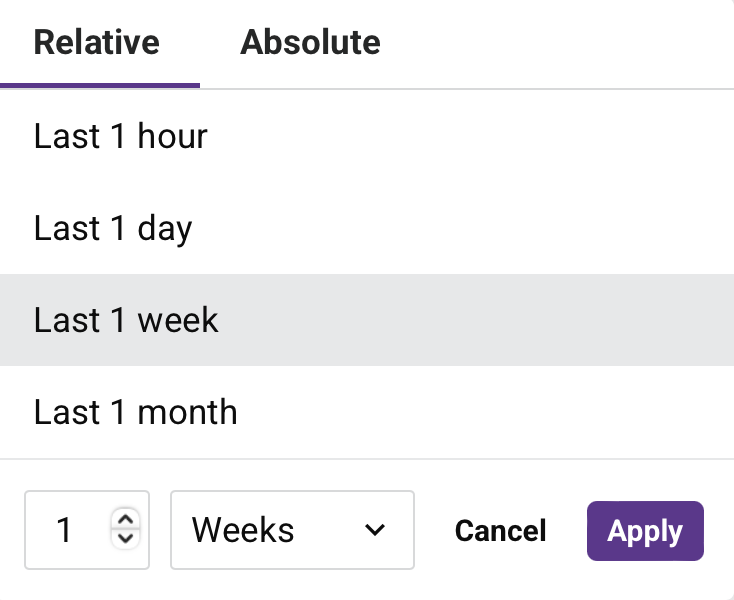
Select one of the preset time ranges:
-
Last 1 hour: Displays analytics data for the past hour.
-
Last 1 day: Displays analytics data for the past day.
-
Last 1 week: Displays analytics data for the past week.
-
Last 1 month: Displays analytics data for the past month.
To create a custom relative time period, use the controls at the bottom of the dialog:
-
Number field: Enter the number of time units (for example,
1,7,30). -
Unit dropdown: Select the time unit from Minutes, Hours, Days, Weeks, or Months.
-
Cancel: Close the dialog without applying changes.
-
Apply: Apply the selected time range and close the dialog.
Absolute tab
The Absolute tab allows you to select a specific date and time range within the past 90 days. Dates outside this range are not selectable. API metrics are available for 30 days, so results are available only for dates within that period:
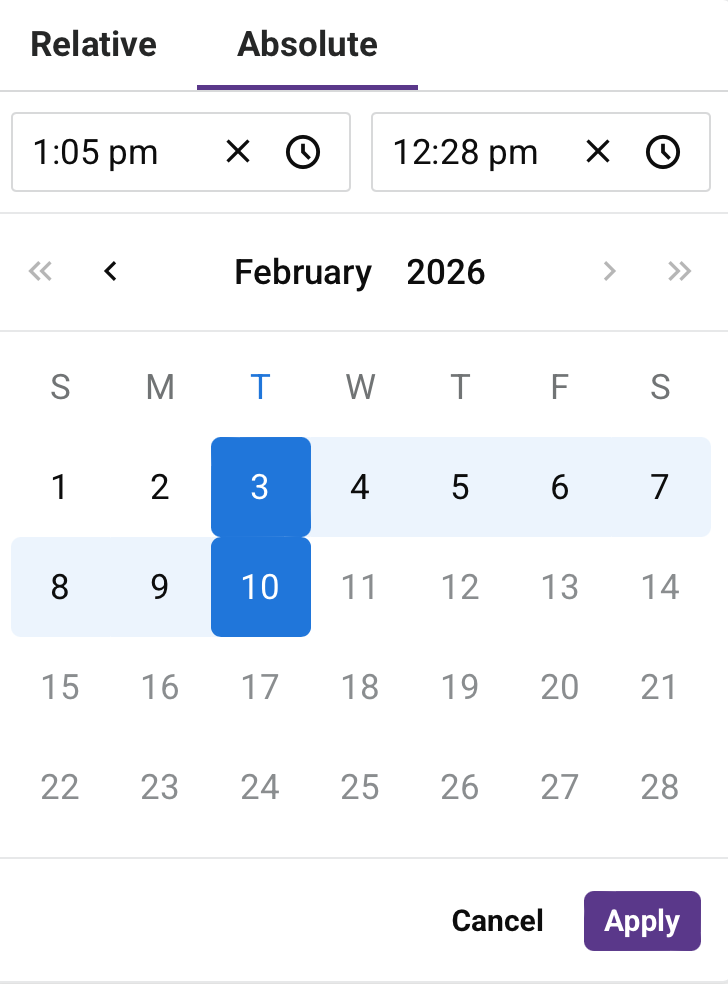
The selected date range displays at the top of the dialog in the format MM/DD/YYYY, HH:mm am/pm - MM/DD/YYYY, HH:mm am/pm.
Configure the date and time range using the following controls:
-
Start time field: Displays the start time for the range. Click to clear, or click to adjust the time.
-
End time field: Displays the end time for the range. Click to clear, or click to adjust the time.
-
Calendar picker: Use the calendar to select start and end dates. Navigate between months using the left and right arrows.
-
Cancel: Close the dialog without applying changes.
-
Apply: Apply the selected date and time range and close the dialog.
Additional time period controls
When a time period is selected and displayed in the header:
-
Click next to the time period display to clear the selected time period and return to the default.
-
Click the calendar icon next to the time period display to reopen the time period selector dialog.
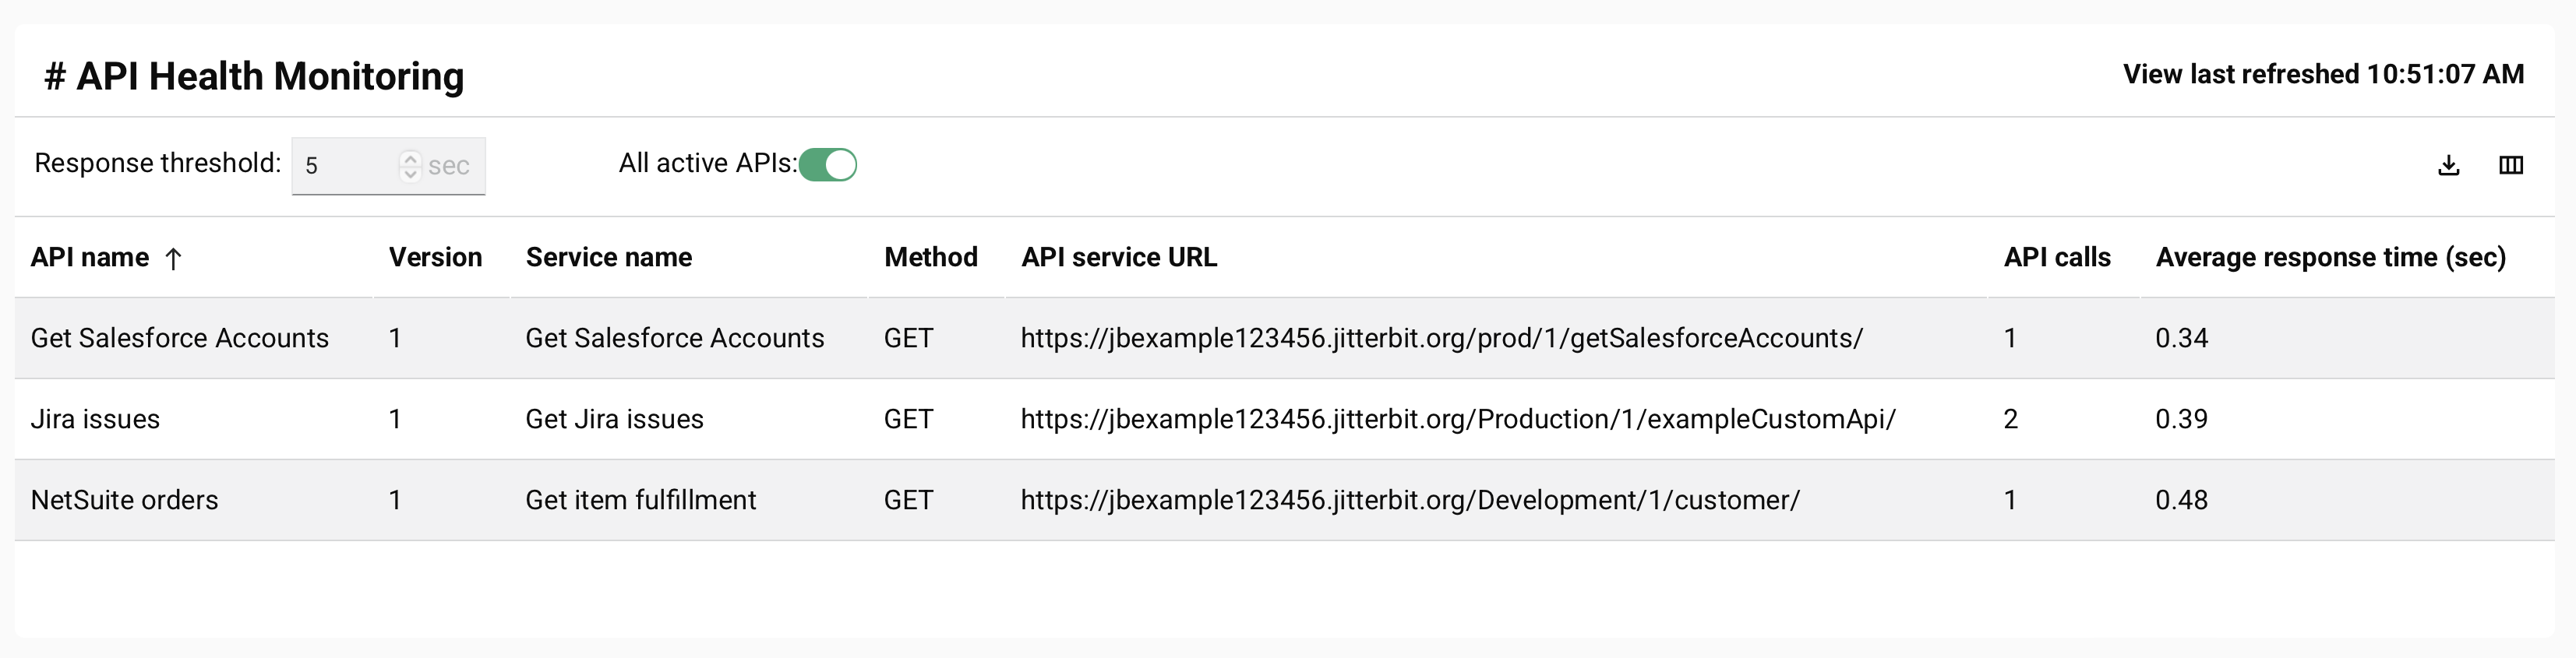
API health monitoring
The API health monitoring table shows a list of slow-running or active custom API calls (occurring within a set time frame) and their response times:
-
Response threshold: Enter the response threshold (in seconds) to display custom API calls with a response time equal to or greater than the provided threshold. The default value is
5seconds and the minimum value allowed is1second. The number provided must be an integer. -
All active APIs: Click to toggle the display within the provided time frame. When toggled off, the table shows only custom APIs whose Response Time is equal to or greater than the provided Response threshold. When toggled on, the table shows all active custom APIs, and the Response threshold field is disabled.
-
API Name: The custom API name. To change the sort order from descending (default) to ascending, click the arrows next to the column name.
-
Version: The version of the custom API (if provided).
-
Service Name: The name of the API service.
-
Method: The request method of the API service.
-
API Service URL: The API service URL.
-
API Calls: The total number of calls to the custom API within the provided time frame.
-
Average Response Time (Sec): The average response time (in seconds) for the custom API call.
-
Min Response Time: The minimum response time (in seconds) recorded for the custom API call.
-
Max Response Time: The maximum response time (in seconds) recorded for the custom API call.
-
Environment: The API's environment.
-
Download as CSV: Click to download the current analytics data based on the applied filters and search criteria.
Note
The date field within the CSV file is a UNIX timestamp that will require conversion if you want to use a different date and time format.
-
Filter columns: Click to change the visibility and order of columns. The Columns side drawer opens.
-
Search: Enter part or all of a column name to reduce the list to those matching the text.
-
Show All: Make all columns visible.
-
Move: Drag and drop to change the position of the column relative to others.
-
Hide: The column is visible. Click to hide it.
-
Show: The column is hidden. Click to show it.
-
Save: Save any changes to the columns.
-
Cancel and Close: Close the columns editor without saving changes.
-
Chart display controls
Each chart described in the following sections includes three icons in the top-right corner:
-
Download as CSV: Click to download the chart data as a CSV file.
Note
The CSV column structure varies by chart type. Charts that display data over time (such as Response time (ms) and Policy violations) export
name,date, andvaluecolumns. Charts that display aggregate data (such as Apps and IP Addresses) export onlynameandvaluecolumns, as those charts are not grouped by date. -
Expand/collapse: Click to expand the chart to a larger view or collapse it back to its default size.
-
Drag: Click and drag to reposition the chart on the page.
Call metrics
Call metrics is a collapsible section that displays multiple charts showing API performance and usage data. Click the section heading to expand or collapse the display.
The section includes the following charts:
- Hits
- Response time (ms)
- Status codes
- Total calls
- Error Analytics
- Org level rate limit utilization
- Policy violations
- Method-level insights
Hits
The Hits chart displays the number of API calls over time.
Three summary badges appear above the chart, each showing a metric value for the selected time period:
- Min: The minimum number of calls recorded in any time period.
- Average: The average number of calls across all time periods.
- Max: The maximum number of calls recorded in any time period.
Each API endpoint is represented by a separate colored line, with the endpoint URL shown in the legend. If more endpoints are plotted than the legend can display, a +N indicator appears; hover over it to see the remaining endpoint URLs.
Hover over any data point to display a tooltip showing the date and the number of calls for that endpoint at that time.
Response time (ms)
The Response time (ms) chart displays the response times in milliseconds for APIs over time.
The chart shows three metrics displayed as badges above the chart:
- Min: The minimum response time in milliseconds in any time period.
- Average: The average response time in milliseconds across all time periods.
- Max: The maximum response time in milliseconds in any time period.
Each API endpoint is represented by a separate colored line, with the endpoint URL shown in the legend. If more endpoints are plotted than the legend can display, a +N indicator appears; hover over it to see the remaining endpoint URLs.
Hover over any data point to display the response time in milliseconds for that endpoint at that specific time.
Status codes
The Status codes chart displays the distribution of HTTP status codes returned by the APIs over time.
The chart displays specific HTTP status codes for all response categories: success (2xx), redirection (3xx), client errors (4xx), and server errors (5xx). This allows you to monitor the distribution of response codes over time.
Hover over any data point to display a tooltip showing the date and the number of calls that returned each status code at that time.
Total calls
The Total calls chart displays the top APIs by call volume within the selected period.
Use the dropdown in the top right to select which APIs to display. Options include Top 5 APIs, Top 10 APIs, Top 25 APIs, and All APIs.
The chart displays a bar chart showing the relative call volume for each API. Each API endpoint is represented by a different color in the legend. If more endpoints are plotted than the legend can display, a +N indicator appears; hover over it to see the remaining endpoint URLs.
Hover over any bar to display a tooltip showing the endpoint URL and its call count.
Error Analytics
The Error Analytics chart displays the number of successful API calls compared to unsuccessful calls over time as a stacked area chart.
The chart displays two categories:
- Status codes 200-299 (success): API calls that returned a success (2xx) or redirection (3xx) response.
- Status codes 400-599 (errors): API calls that returned a client error (4xx) or server error (5xx) response.
Hover over any data point to display a tooltip showing the time and the number of calls for that category at that time.
Org level rate limit utilization
The Org level rate limit utilization chart displays the average number of calls per minute for the organization during each time period.
Hover over any data point to display a tooltip showing the date and the average rate limit for that time period.
Policy violations
The Policy violations chart displays the number of API calls that failed due to access rule violations over time.
Policy violations are categorized by the type of failure:
- Failed Authentication (401): API calls that received HTTP status code 401 (
Unauthorized), indicating the request lacked valid authentication credentials. - Rate Limit Violation (429): API calls that received HTTP status code 429 (
Too Many Requests), indicating the rate limit threshold was exceeded.
Only categories with recorded data for the selected time period appear in the chart. If no policy violations have occurred during the selected time period, the message "No data found." displays.
Hover over any data point to display a tooltip showing the date and the number of violations for that category at that time.
Method-level insights
The Method-level insights chart displays the breakdown of API calls by HTTP method (GET, POST, PUT, or DELETE) over time.
The chart displays each HTTP method with a different color in the legend. This allows you to analyze which methods are used most frequently to access the APIs.
Hover over any data point to display the number of calls for that method during the time period.
API consumers
API consumers is a collapsible section that displays consumption metrics for the APIs in your organization. The section includes two charts: Apps and IP Addresses.
Apps
The Apps chart displays the top API consumers (applications) by call volume within the selected period.
Use the dropdown to select the number of apps to display. Options include Top 5 apps, Top 10 apps, Top 25 apps, and All apps.
The chart displays a bar chart showing the relative call volume for each application. Hover over any bar to display the exact number of calls and the application name.
Note
If an API is accessed without authentication or consumer identification, it displays as "Anonymous" in the chart.
IP Addresses
The IP Addresses chart displays the top IP addresses by call volume within the selected period.
Use the dropdown to select the number of IP addresses to display. Options include Top 5 IP addresses, Top 10 IP addresses, Top 25 IP addresses, and All IP addresses.
The chart displays a bar chart showing the relative call volume for each IP address. Hover over any bar to display the exact number of calls and the IP address.