Operation debug logging for Jitterbit cloud agents
Introduction
Operation debug logging generates additional diagnostic information to help with troubleshooting. This feature produces the following type of data:
- Component input and output data: The request and response data processed by each activity and transformation in an operation. Harmony retains this data for 30 days.
Warning
When component input and output data are generated, all request and response data for that operation are logged to the Harmony cloud and remain there for 30 days. Personally identifiable information (PII) and sensitive data such as credentials provided in a request payload will be visible in clear text in the input and output data within the Harmony cloud logs.
Because of these security implications, use operation debug logging only for debugging problems during testing. Do not enable this feature in a production environment.
Enable operation debug logging
You can enable debug logging for an individual Studio or Design Studio operation with these steps:
-
Studio: Use an operation's actions menu to select Settings. In the Options tab, select Enable Debug Logging Until and set a date for debug logging to be turned off. The option to cascade the debug mode settings to any child operations is also available.
-
Design Studio: Right-click the background of any operation and select Options. In the Operation Options window, select Enable Debug Mode Until and set a date for debug logging to be turned off.
This date is limited to 2 weeks from the current date. Operation debug logging turns off at the beginning of this date (that is, at 12:00 am) using the agent time zone.
Warning
On cloud agent groups, the duration of this setting is unreliable. Logs may stop being generated before the end of the selected time period.
View operation logs
When you enable operation debug logging, you can view operation logs in two locations:
- Studio operation logs: View logs from the operation's View Logs menu in Studio.
- Runtime page: View logs on the Management Console Runtime page.
Both locations display operation logs with component input and output data (when available) and API request and response data (when the operation is triggered by an API Manager custom API). Request and response payload is included only when Show Request & Response Payloads in Logs is also enabled in the API's Settings tab.
Component input and output data
Component input and output data is generated when a Studio operation that has operation debug logging enabled at the operation level is executed. Input and output data are available only for activities and transformations used as operation steps.
Caution
The generation of component input and output data is unaffected by the agent group setting Cloud logging enabled. Component input and output data will be logged to the Harmony cloud even if cloud logging is disabled.
Input and output data access
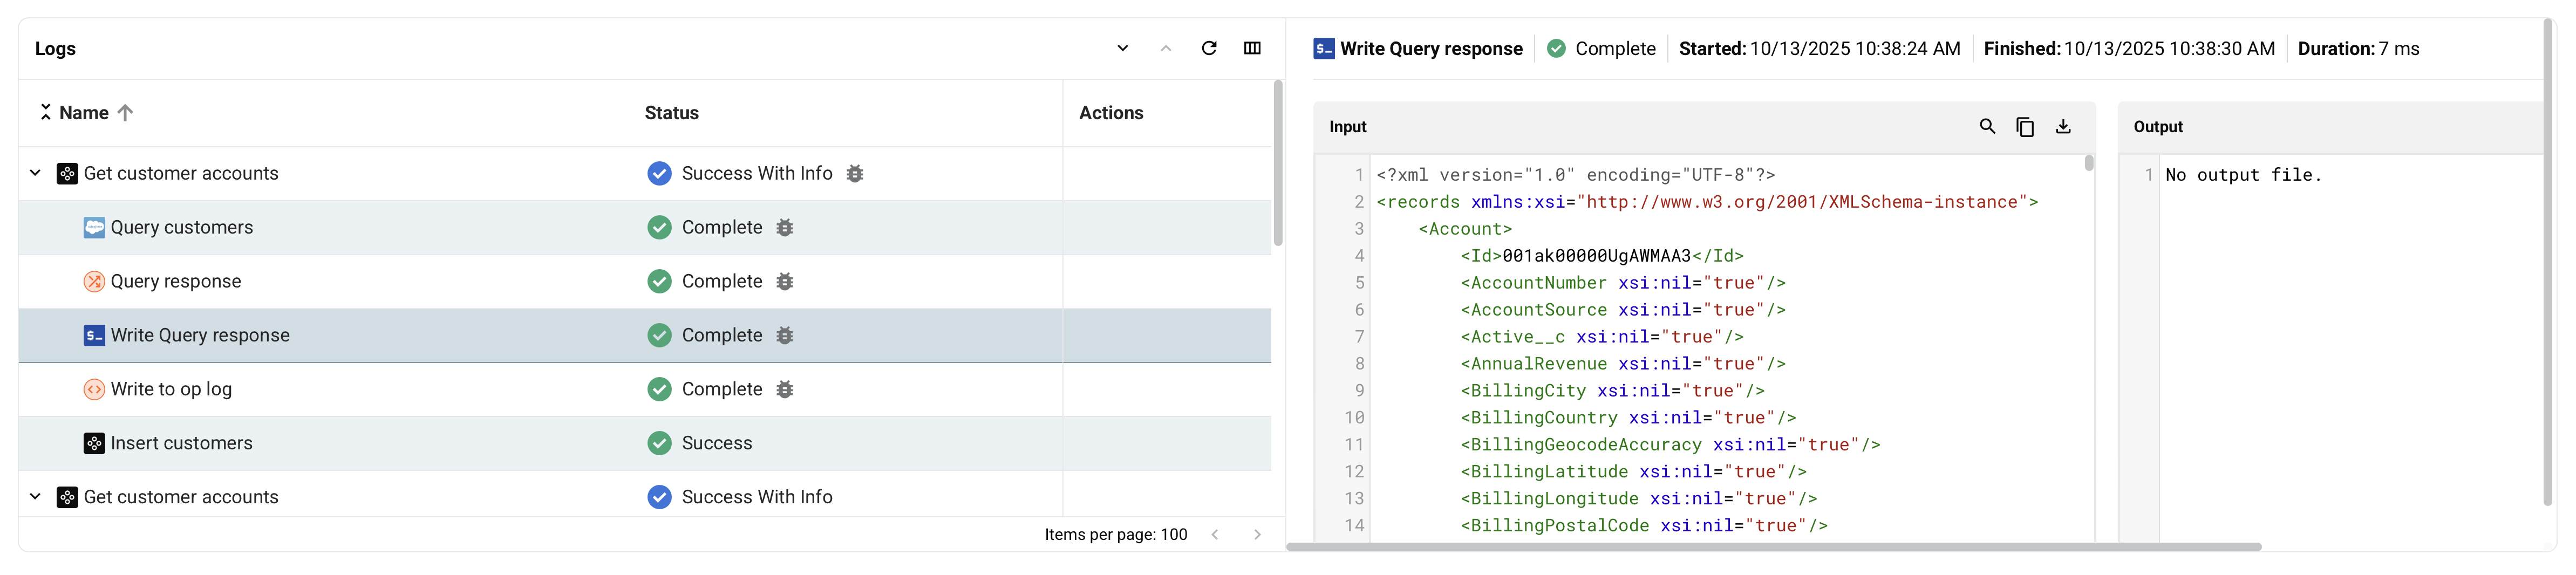
Component input and output data is accessed from the Studio operation log screen or the Management Console's Runtime page in additional table rows shown for each operation step that has input and output data. In the Input/Output column, icons for activities and transformations used as operation steps can be clicked to show or hide the component input and output data for that individual operation step. Each input and output log entry is limited to 100 MB. If the data for an individual input or output log entry exceeds 100 MB, no data will be displayed.
- Search: Search the data for the entered text.
- Copy: Copies the log data to your clipboard.
- Download: Downloads the input or output data. The file is named with the operation step name followed by
_inputor_outputas appropriate.
Input and output data retention policy
Component input and output data is retained for 30 days by Harmony.
Input and output data contents
Component input and output data is generated for certain steps of an operation. The data is appropriate to the function of a step. The input is the structure that the component consumes, while the output is the structure that the component produces.
Input and output data is generated for these components used as operation steps:
- Activities: Input and output data and any related information for the execution of the activity. Some activities may have multiple input and output files.
- Transformations: Input and output data for the execution of the transformation.
Input and output data is not applicable to scripts when you use them as operation steps. Script content, such as that produced by the WritetoOperationLog function, is displayed in the log messages of an operation log.