Dashboard page in Jitterbit Management Console
Overview
| Purpose | One-page overview of key Management Console functions |
| Location | Harmony portal menu > Management Console > Dashboard |
| Page access | Users with Admin or Read role permissions |
Introduction
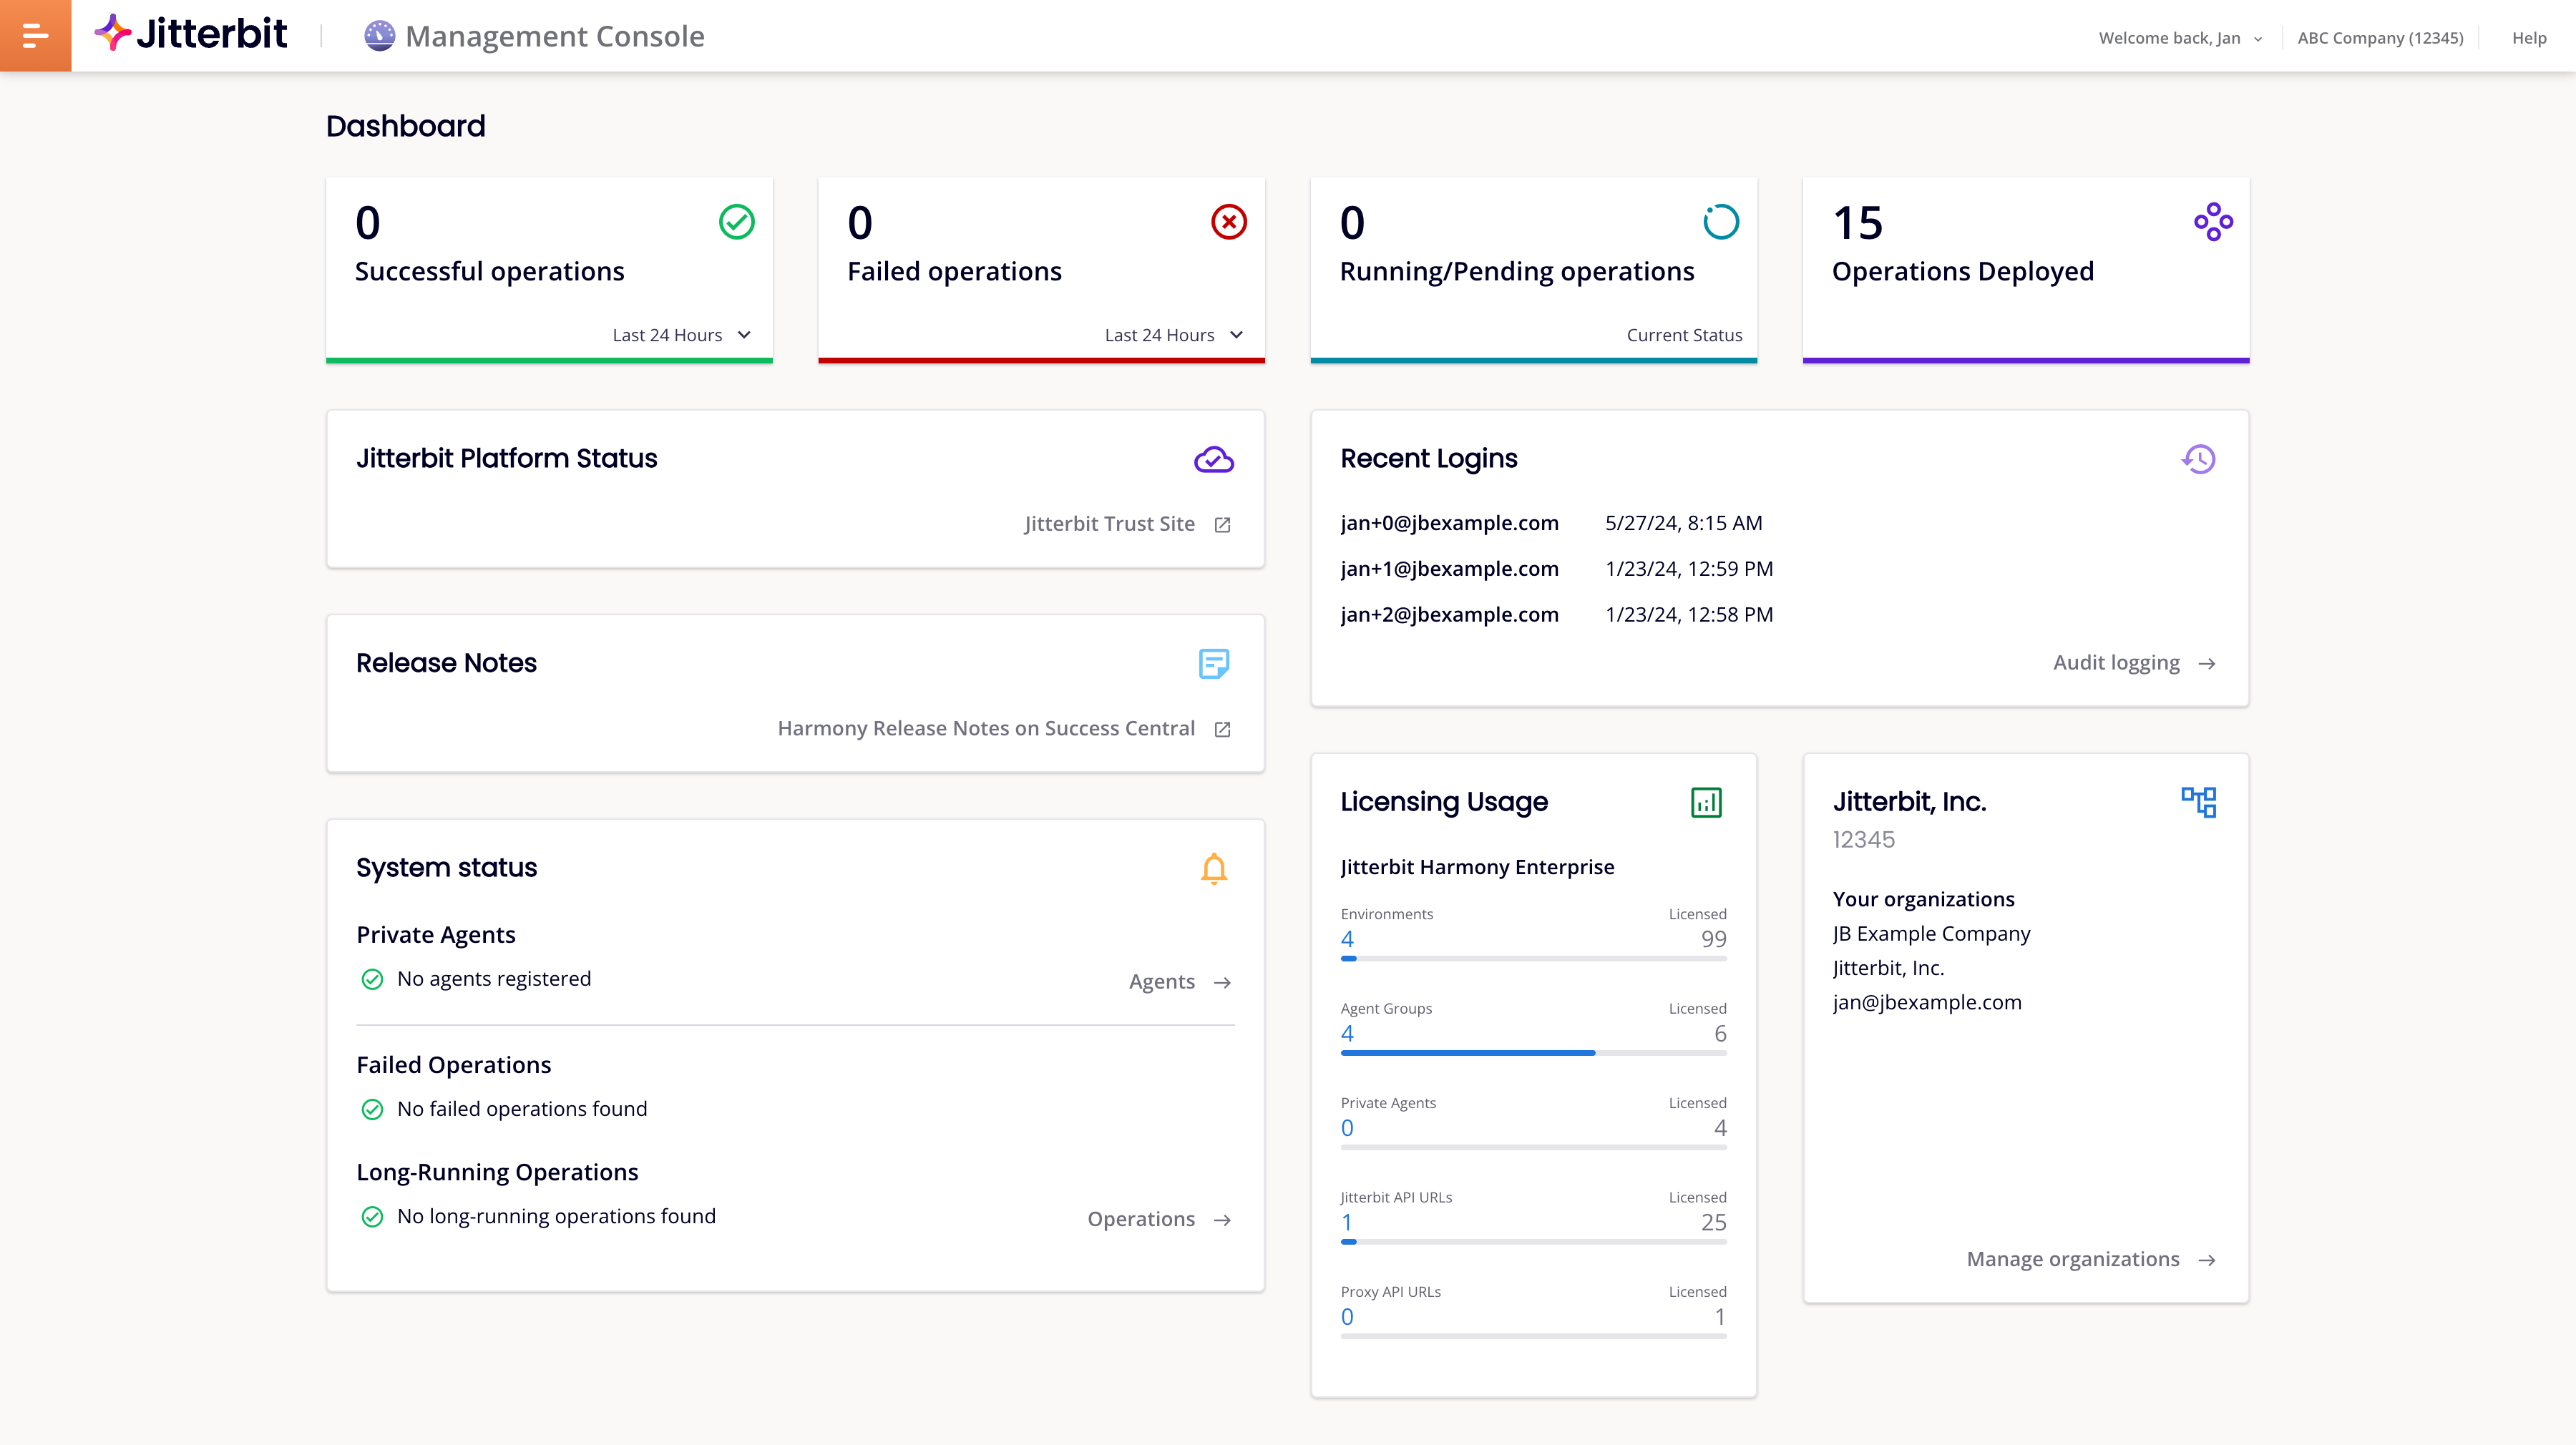
The Dashboard page of the Management Console provides a central location to manage and monitor the status of your Harmony integration projects. The page is refreshed every 15 minutes.
Dashboard tiles
The Dashboard page displays these tiles:
-
Successful operations: Displays the number of operations with a
Success,Success with Info,Success with Warning, orSuccess with Child Errorstatus (maximum 10,000). Click this tile to navigate to the Runtime page, filtered to display all operations with these statuses.- Last 24 Hours: Use the menu to select whether to display the number of successful operations for the Last 24 Hours or Last 48 Hours. Successful operations for the selected period are between 12:00 am to 11:59 pm on your local machine's time zone.
-
Failed operations: Displays the number of unsuccessful operations with an
Error,Cancelled,Cancel Requested, orSOAP Faultstatus (maximum 10,000). Click this tile to navigate to the Runtime page, filtered to display all operations with these statuses.- Last 24 Hours: Use the menu to select whether to display the number of unsuccessful operations for the Last 24 Hours or Last 48 Hours. Unsuccessful operations for the selected period are between 12:00 am to 11:59 pm on your local machine's time zone.
-
Running/Pending operations: Displays the number of operations with a
Submitted,Pending,Running, orReceivedstatus (maximum 10,000). Click this tile to navigate to the Runtime page, filtered to display operations with these statuses. -
Operations Deployed: Displays the number of currently deployed operations (maximum 10,000). Click this tile to navigate to the Runtime page.
Note
For operations that have been deployed more than once, the number displayed in the tile does not include any subsequent deploys for an operation.
-
System status: Displays the status of any private agents, failed operations, and long-running operations. Click Agents to navigate to the Management Console Agents page or Operations to navigate to the Runtime page.
Note
Long-running operations are operations that have been running for 20 minutes or longer. Only two long-running operations for an organization are displayed on this tile.
-
Recent Logins: Displays the five most recent users to log in to the selected organization. Login information is shown only for users that have the selected organization set as their default organization. The date and time of the login is displayed next to the username. Click Audit Logging to navigate to the Audit Logging page.
-
Licensed vs Actual Use: Displays this information:
-
The current Harmony organization's subscription type.
-
Endpoints: The number of licensed endpoints and how many have been used in the current month.
Actual usage reflects the number of unique endpoints used in a Studio or Design Studio operation that has been run at least once within the past 1 month on agents version 11.49 or later in an environment classified as a Production environment. Actual usage is not limited to successful operations; operations with any final operation status, including failed operations, are counted.
Click to open the Endpoints Usage page, where you can see details about all endpoints currently being used, including each endpoint's Endpoint unique identifier values used to determine a unique endpoint.
-
Private agents: The number of licensed private agents and how many are added. (An agent counts toward your limit when added, even if left unregistered.) Click to open the Private tab of the Management Console Agents page.
-
Agent grouping for HA: The number of agent groups licensed for high availability (HA) and how many are in use. This licensing metric refers to the configuration of agent groups with two or more agents for the purpose of load sharing and high availability in executing operations.
Actual usage reflects the number of agent groups with two or more agents used over the past 12 months in an environment classified as a Production environment.
Click to open the Private tab of the Management Console Agents page, where you can change the agent group classification.
-
Environments: The number of licensed environments and how many are added. Click to open the Management Console Environments page.
-
Jitterbit API URLs: The number of licensed API Manager APIs and how many are published. Click to open the API Manager APIs page, with the Custom API filter applied.
-
Proxy API URLs: The number of licensed API Manager proxy APIs and how many are published. Click to open the API Manager APIs page, with the Proxy API filter applied.
-
API monthly calls: The number of licensed API Manager API monthly calls and how many have been consumed in the current month. Hover to see the exact value. Click to open the API Manager Analytics page.
All API types are counted. Currently, only success code 200 is counted toward usage.
Your licensed limit of API calls is not system-enforced. In a given month, the number of APIs consumed may exceed the licensed number.
-
EDI trading partners: The number of licensed trading partners and how many are configured in Jitterbit EDI. Click to open the EDI Admin page.
-
MQ monthly messages: The number of licensed Jitterbit MQ messages and how many have been transmitted in the current month. Click to open the Usage tab of the Management Console Message Queues page.
-
Cloud Datastore storages: The number of licensed Cloud Datastore storage items and how many are configured. Click to open the Usage tab of the Management Console Cloud Datastore page.
Tip
To change your licensed limits, contact your Customer Success Manager (CSM).
-
-
Selected organization: Displays this information:
-
The name of the currently selected organization.
-
The Harmony organization ID for the currently selected organization.
-
A list of any other organizations of which you are a member.
Click Manage organizations to open to the Organizations page.
-
-
Jitterbit Platform Status: Click Jitterbit Trust Site to navigate to the Jitterbit Trust Site, which provides information on Harmony availability and security statuses.
-
Agents Health: A summary of the health of agent groups with native observability metrics enabled. Click the icon to open the Metrics tab of the Management Console Agents page.
-
Release Notes: Click to navigate to the Harmony release notes.
Rearrange tiles
The positions of the top four tiles are fixed, but you can change the relative positions of the remaining tiles.
To do this, hover on a tile to reveal the Move handle, then drag and drop to move the tile.