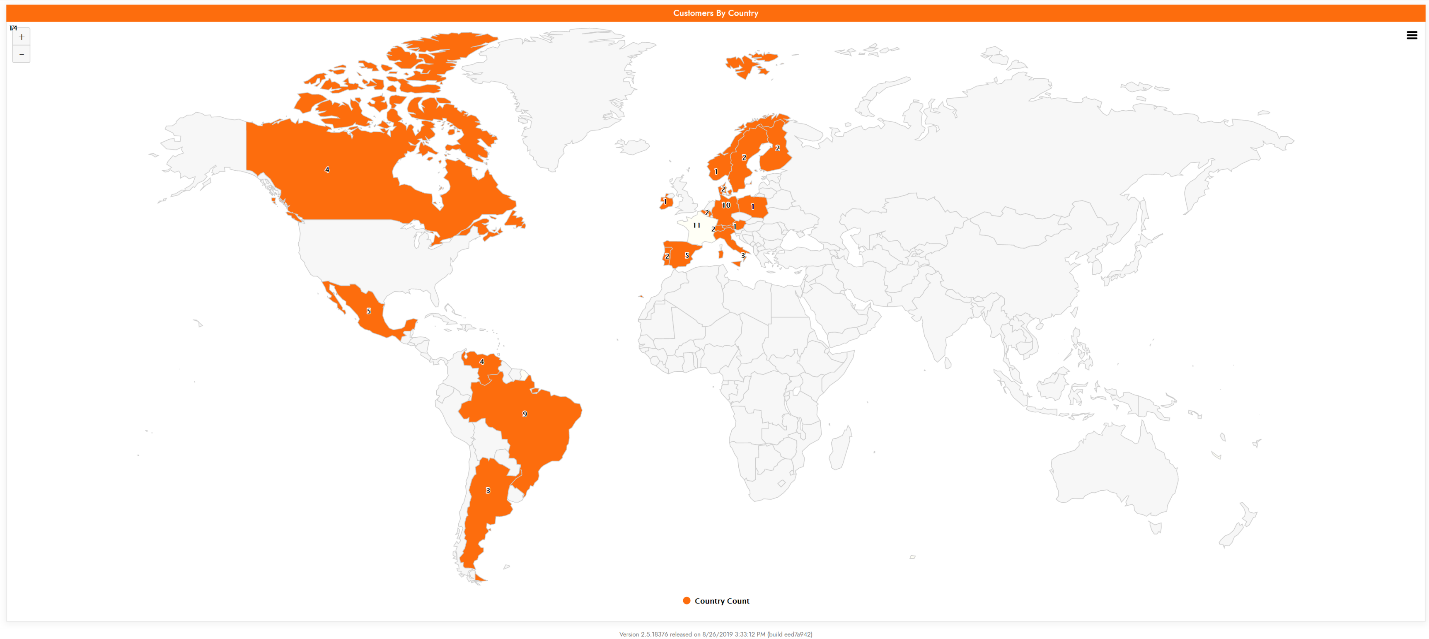
Map panel in Jitterbit App Builder
App Builder has a Map panel option that supports displaying a Map where Controls can be visualized via geographic location. Different maps provided through the Highmaps API can be chosen based on the data you wish to be displayed.
Names of map regions in your underlying Business Object must match identifiers from the Highmaps source maps; this can require extra attention to ensure your Business Object key can be recognized by the source map.
For example, if you have a Business Object with US County names, County names may not be unique; in this case you must have a column that matches the key from Highmaps.
The following is US County data retrieved from the Highmaps API:
| Highmap API Property | Value |
|---|---|
| hc-key | us-mn-053 |
| name | Hennepin |
If your data has a hyphen, the source map will default to joining by hc-key, otherwise it will join to the name. Depending on the source map you choose, there may be intermediate defaults the source map will attempt to join to in your provided data.
Please reference https://api.highcharts.com/highmaps/ for documentation regarding source maps provided in the map panel. You can also visit http://code.highcharts.com/mapdata/ for demos of the datasets.
Map Panels allow a User to zoom in on the Chart itself, to view a certain region of information zoomed in on from the chart. To zoom, left click and scroll forwards, then left click and drag the map in the direction that pulls the desired area of focus into the center of the screen. To zoom out, left click and scroll backwards.
To create a Map Panel, you'll need a Business Object that contains information for the controls the chart requires. Like other chart panels, Category and Value are required controls; Color and JSON Options Object are optional values that can also be stored.
An example Business Object will have a geographic location as a Category, and a quantity of some attribute associated with the location as a Value.

Example data
| Control Type | Column | Data Value Example |
|---|---|---|
| Category | Country | Argentina |
| Value | CountryCount | 3 |
| Color | N/A | N/A |
| JSON Option Object | N/A | N/A |
The Business Object used to create this map used the Northwinds Customers table and only has two columns: Country, and CountryCount (using expression Count(1)). This provides the Map Panel with the Country Name and the number of Customer records per country.
The Country Column matches the "name" property from the Highmaps API, which in this case did not cause problems as country names were unique.
How to create a map panel
This assumes you already have a Business Object which contains all the Controls you'll need to work with for the Map Panel.
- Create a Dynamic Page to contain the Map panel
- Add a panel to the page, select Map as the Type
- For the Source select the Business Object created for the Map Panel
-
For Map Source choose a map that will best represent your data.
- Example is
custom/world/world
- Example is
-
Add in the Controls required for the type of Map Panel being created:
- Category is required. For example: Country
- Value is required. For example: Country Count
- JSON Option Object is optional Color is optional
-
Run the Page and test the Map Panel