Configure REST/web service logging in Jitterbit App Builder
App Builder supports the ability to log various web service requests. For example:
- REST Datasource calls (a request made to an external system)
- REST API calls (a request made to App Builder itself)
- Webhooks
A running log of these events can be viewed by navigating to:
- IDE > REST APIs > Logs

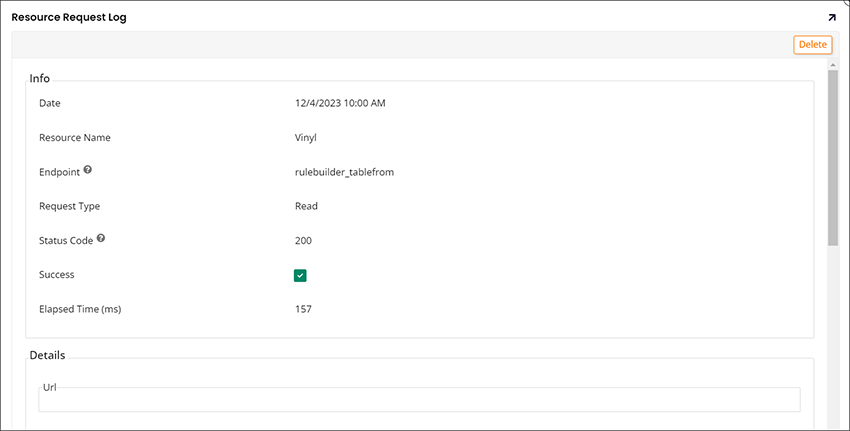
The information captured is as follows:
- Date the request was received
- Resource Name
- Resource Endpoint
- Request Type
- Status Code
- Success
- External (if the request is made to an external system)
- Elapsed Time (in milliseconds)
Detailed logging
Detailed logging can be enabled for Web Services and allows a much deeper capture of the request. In particular detailed logging will capture:
- URL
- Request/Response Header
- Request/Response Bodies

Configuration
To configure detailed logging, configure a logging filter by executing the following steps:
- Navigate to IDE > REST APIs > Logs
- Click the Configuration button
For a REST API:
- Configure the App the API call is destined for
- Optionally select an individual Table
For a REST datasource or webhook:
- Configure the Data Source the REST call uses
- Optionally select an individual Table
Other common optional parameters:
- Select a Status Code Range e.g. 400-499
- Select a Disable After time in minutes (e.g. 90 to have detailed logging active for 90 minutes)
Make the filter active:
- Check the Active flag to activate the filter
After making these configuration changes, the web service request should include detailed logging.