Observability dashboards (Beta) for Jitterbit private agents 11.37 or later
Introduction
The following sections show example private agent observability dashboard charts, what the chart illustrates, and which metrics the chart is based on.
The images shown are from the Datadog dashboard. Elasticsearch dashboards contain the same charts and metrics.
Expand the following section to see a full-screen view of an example Datadog dashboard:
Datadog dashboard example
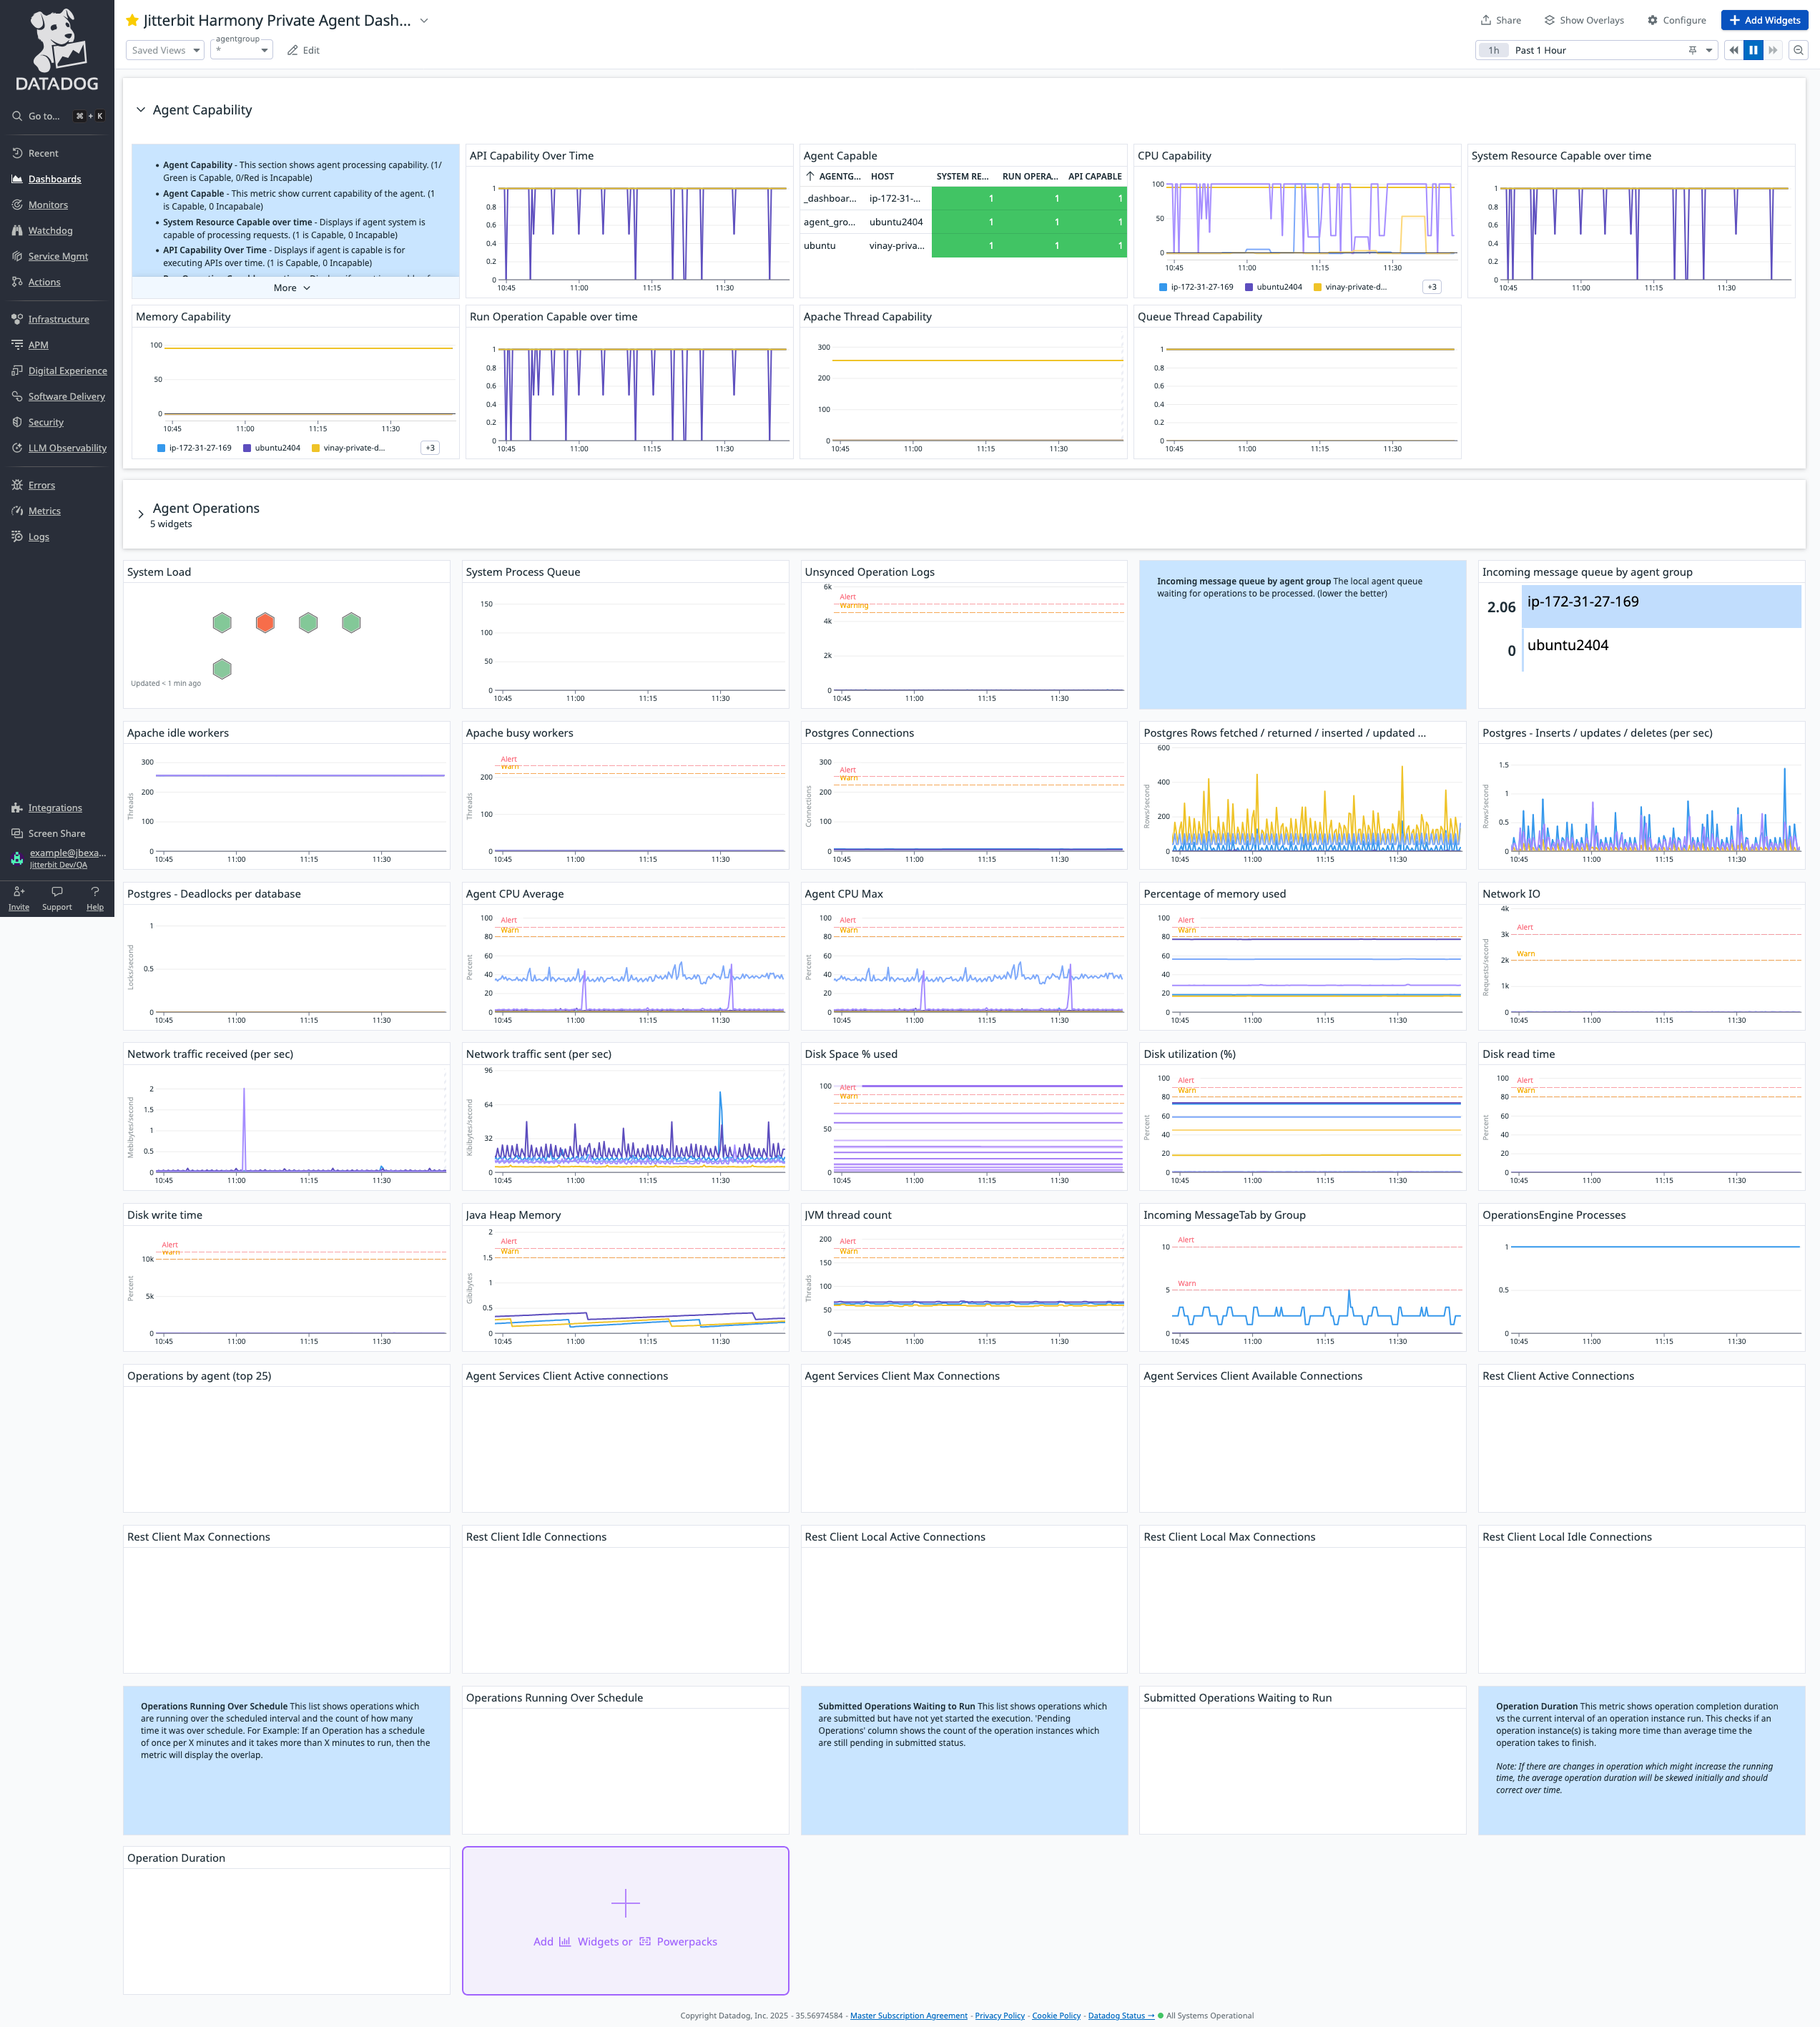
Agent Capability (section)
This section's charts show the agent's capability, its ability to process requests. The values are:
-
Capable: Value
1(shown in green). A capable agent can accept more operations for processing. -
Incapable: Value
0(shown in red). An incapable agent has reached its maximum capacity for processing and cannot accept more operations for processing.
Tip
Availability and capability are separate concepts; an agent can be both available (registered as online) and incapable (busy processing its maximum workload).
API Capability Over Time
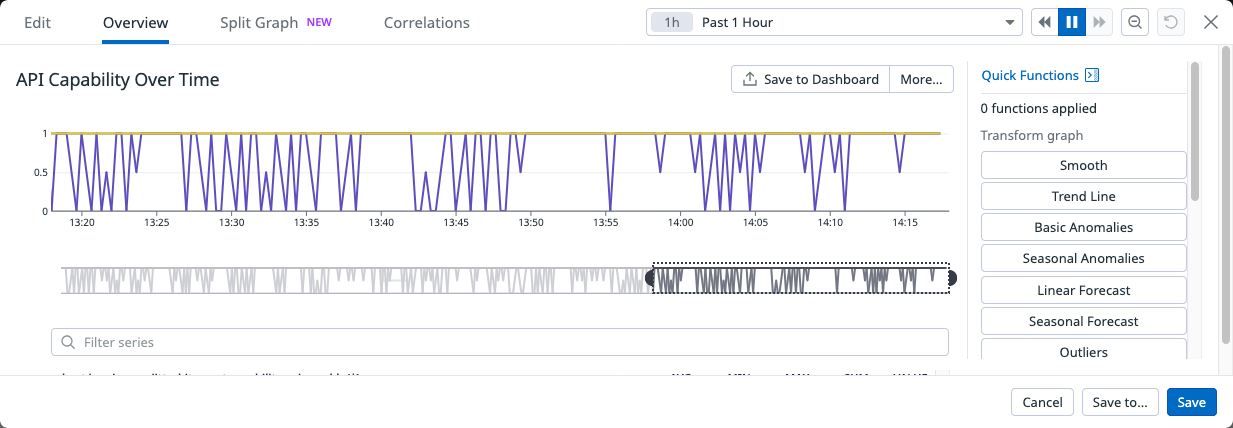
How the agent's capability to execute APIs has changed over time.
| Metric | Description |
|---|---|
com.jitterbit.agent.capability.api.capable |
Agent can handle APIs. |
Agent Capable
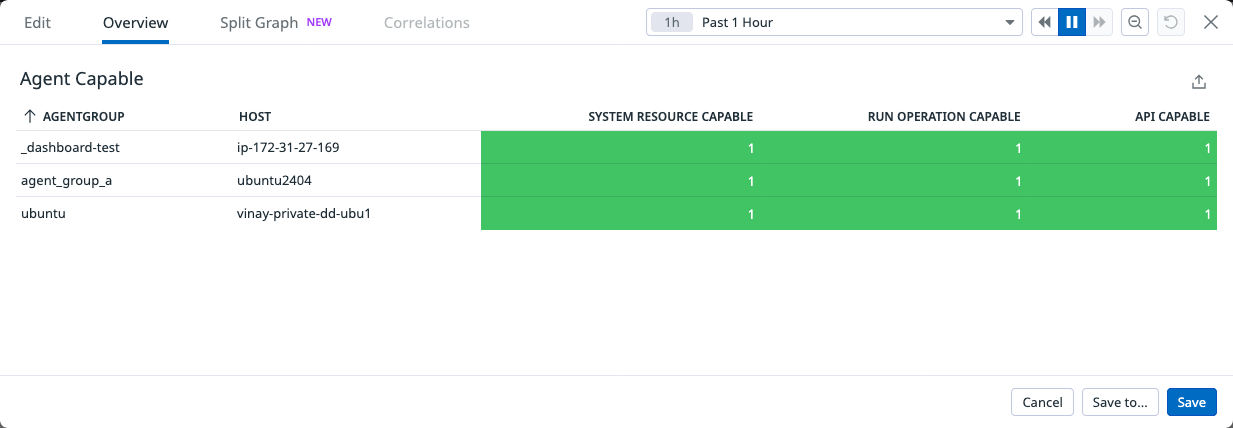
At-a-glance status indication of each agent's capability across these metrics:
| Metric | Description |
|---|---|
com.jitterbit.agent.capability.system.resource.capable |
Agent can process operations. |
com.jitterbit.agent.capability.runop.capable |
Agent can run operations. |
com.jitterbit.agent.capability.api.capable |
Agent can handle APIs. |
CPU Capability
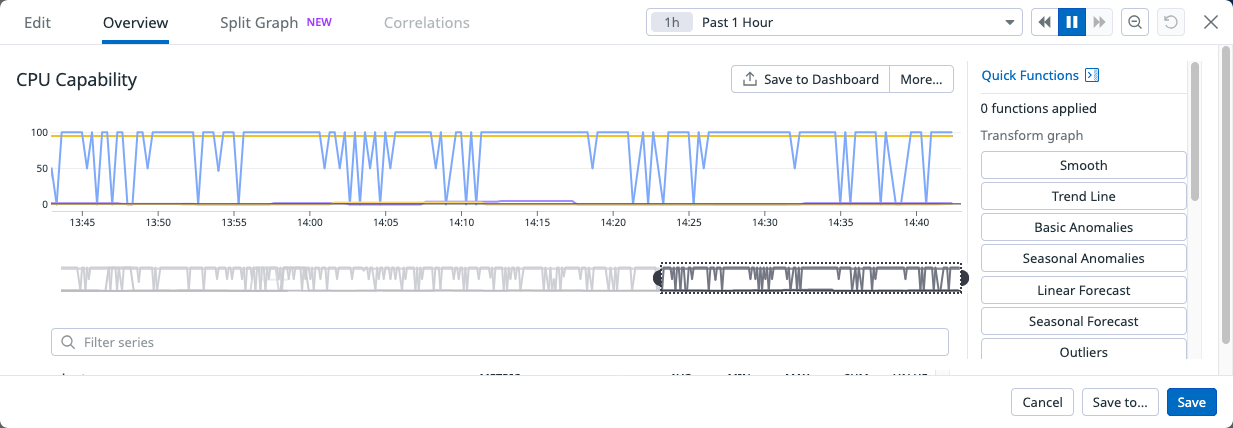
The agent's CPU usage and CPU threshold values over time.
| Metric | Description |
|---|---|
com.jitterbit.agent.capability.cpu.usage |
Agent host's CPU usage. |
com.jitterbit.agent.capability.cpu.max.threshold |
CPU threshold. |
System Resource Capable over time
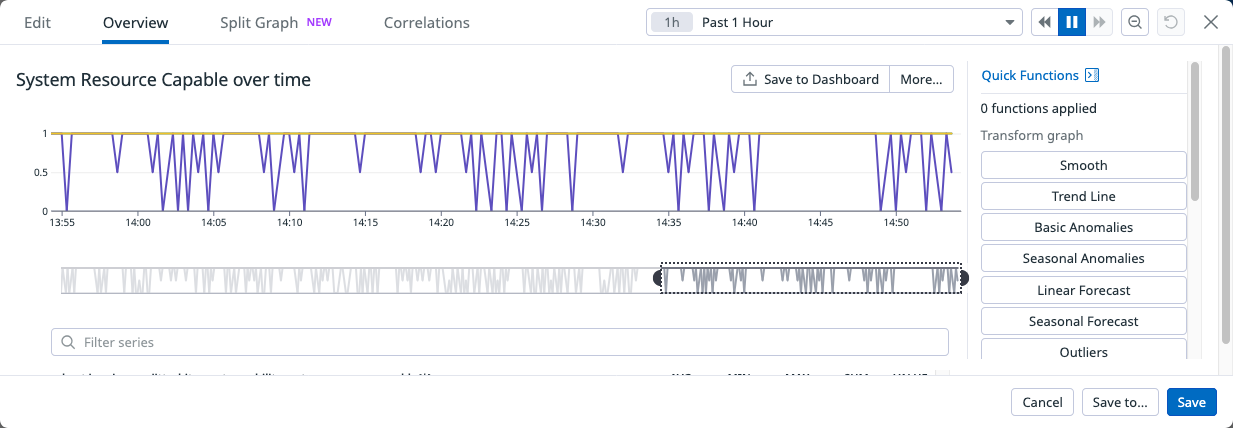
The agent host's resource capability across time.
| Metric | Description |
|---|---|
com.jitterbit.agent.capability.system.resource.capable |
Agent host's resource capability (1 = capable, 0 = not capable). |
Memory Capability
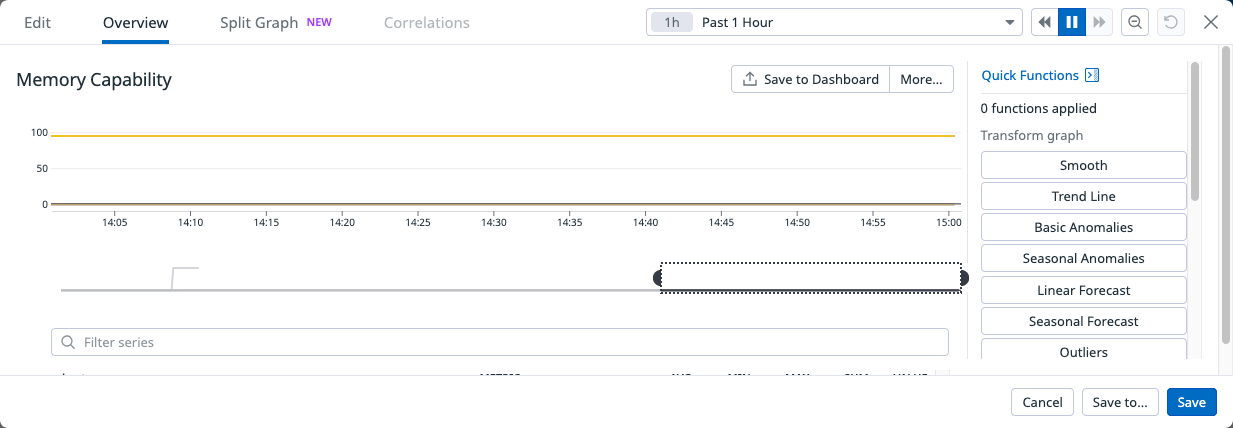
The agent host's memory usage and memory threshold values over time.
| Metric | Description |
|---|---|
com.jitterbit.agent.capability.memory.usage |
Agent host's memory usage. |
com.jitterbit.agent.capability.memory.max.threshold |
Memory threshold. |
Run Operation Capable over time
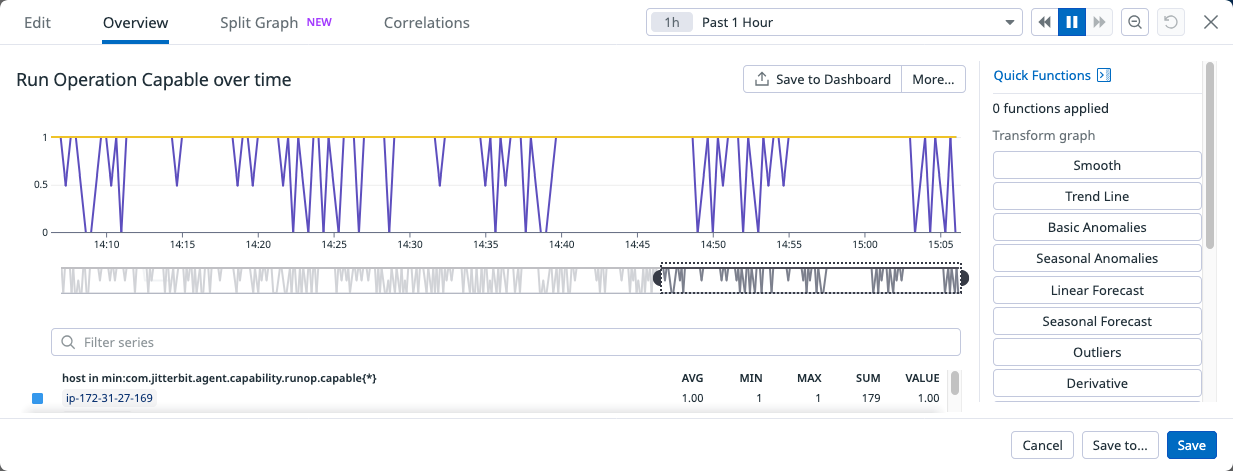
The agent's capability to run operations over time.
| Metric | Description |
|---|---|
com.jitterbit.agent.capability.runop.capable |
Agent's operation execution capability (1 = capable, 0 = not capable). |
Apache Thread Capability
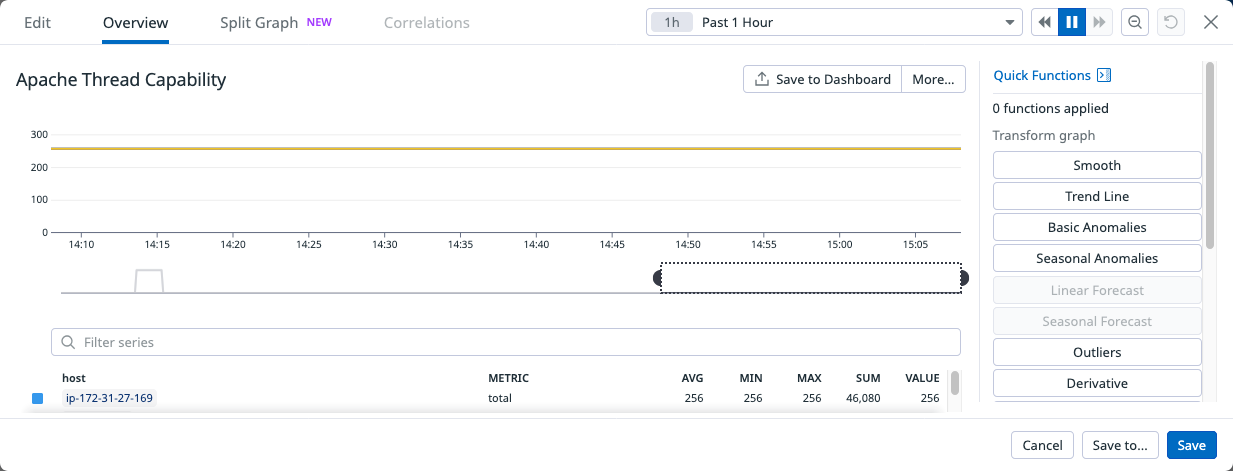
The number of threads and the thread threshold for the agent's Apache web server.
| Metric | Description |
|---|---|
com.jitterbit.agent.capability.apache.usage |
Number of Apache threads used. |
com.jitterbit.agent.capability.apache.total |
Number of allowed Apache threads. |
Queue Thread Capability
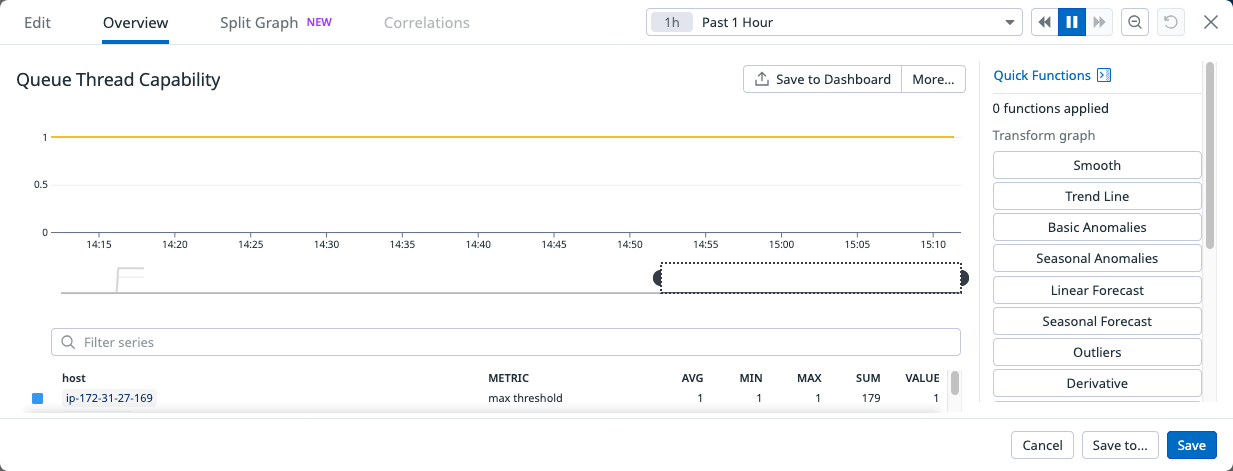
The number of queue threads and the queue thread threshold for the agent.
| Metric | Description |
|---|---|
com.jitterbit.agent.capability.queue.usage |
Number of queue threads used. |
com.jitterbit.agent.capability.queue.max |
Number of allowed queue threads. |
Agent Operations (section)
Operations over time
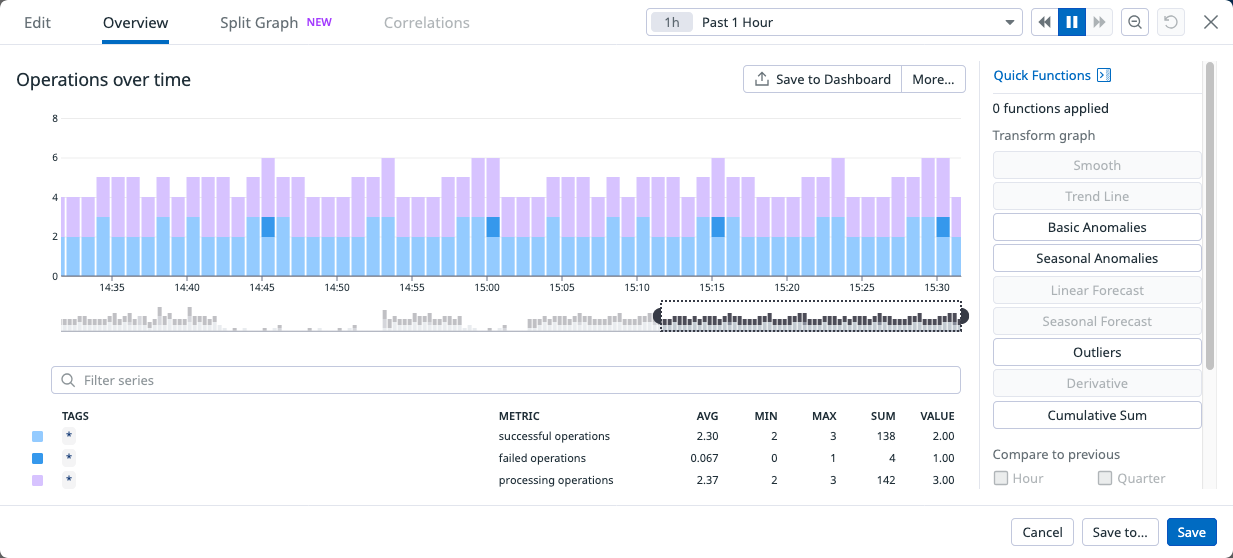
The number of successful, failed, and processing operations over time.
| Metric | Description |
|---|---|
metric.operation.count.by.status |
Number of operations per tagged state (successful, failed, processing). |
Operations statuses over time
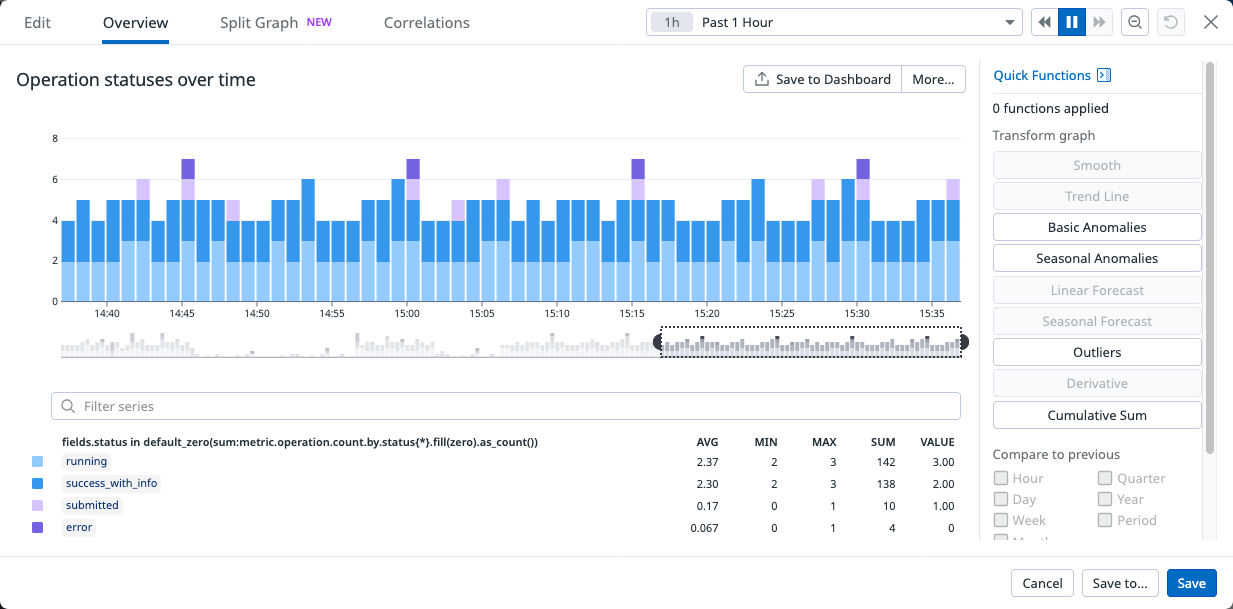
The number of running, successful (with information), submitted, and error operations over time.
| Metric | Description |
|---|---|
metric.operation.count.by.status |
Number of operations per tagged state (running, success_with_info, submitted, error). |
Top 10 Operations
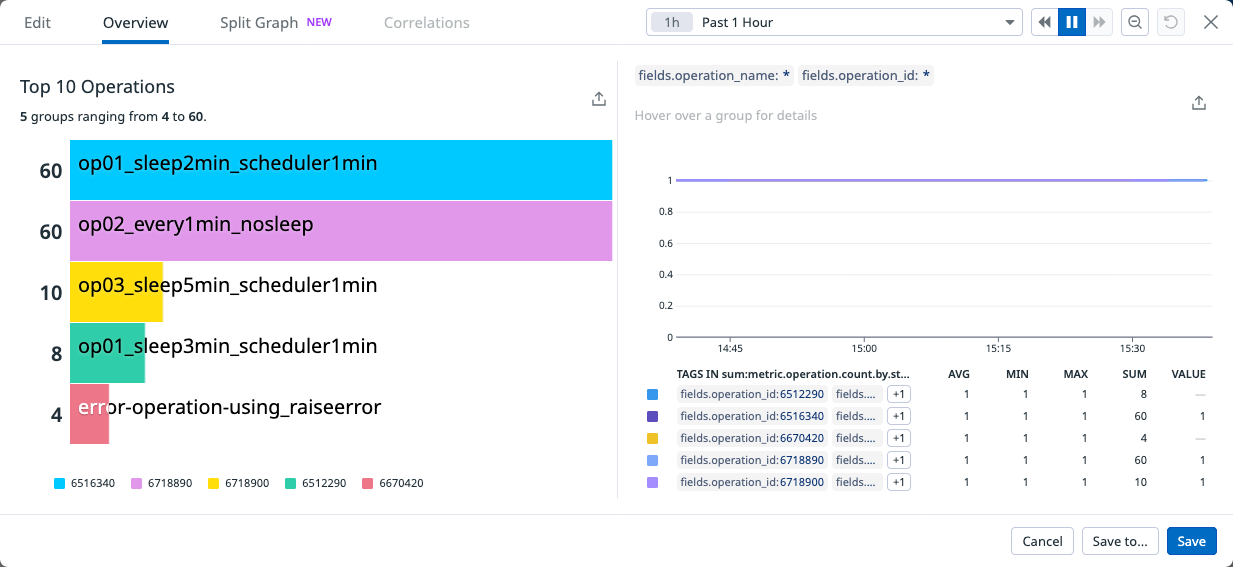
| Metric | Description |
|---|---|
metric.operation.count.by.status |
Number of operations per tagged state. |
Top 10 Successful
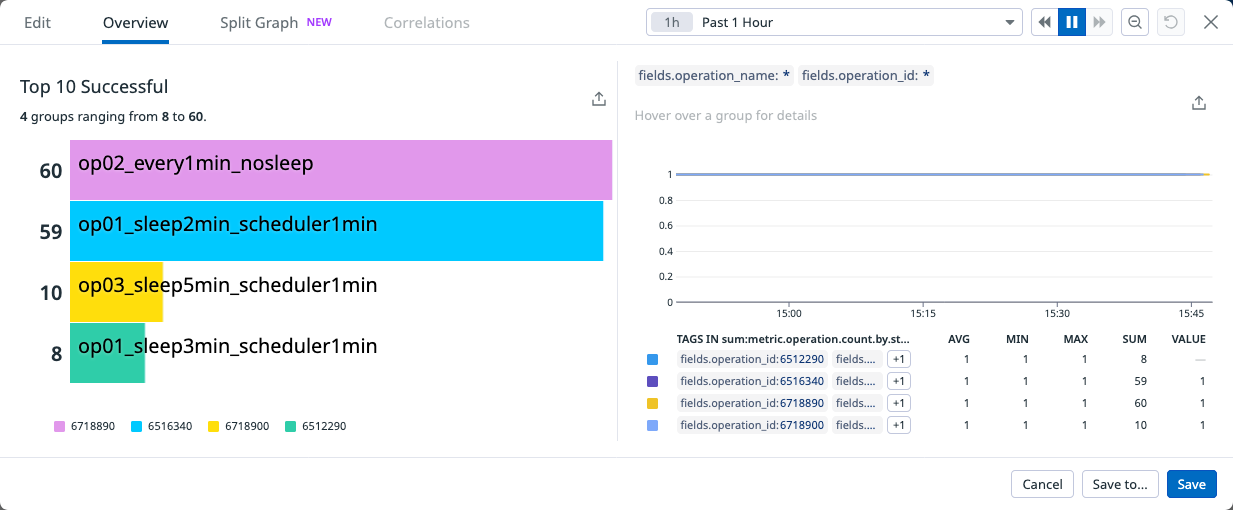
| Metric | Description |
|---|---|
metric.operation.count.by.status |
Number of operations per tagged state. |
Top 10 Failed
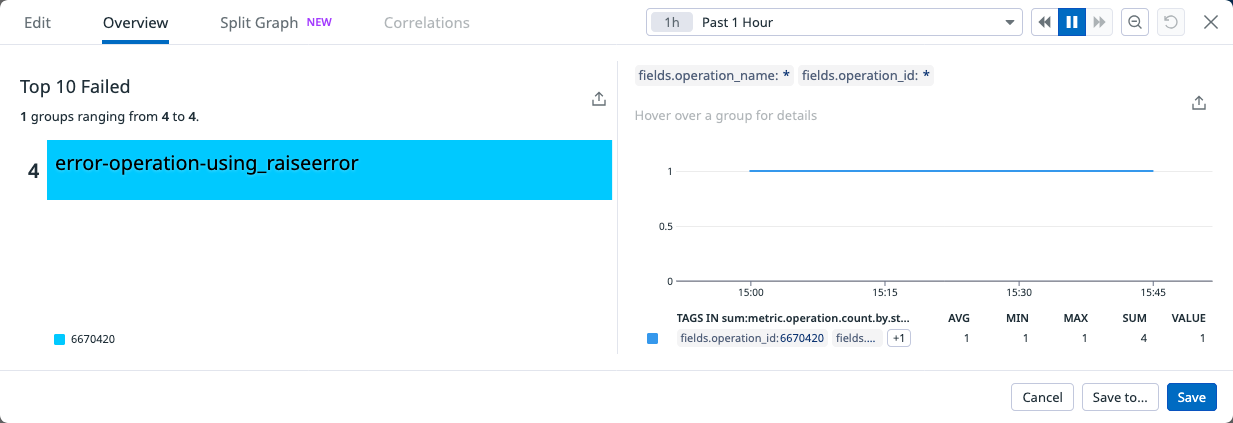
| Metric | Description |
|---|---|
metric.operation.count.by.status |
Number of operations per tagged state. |
System Load (Linux only)
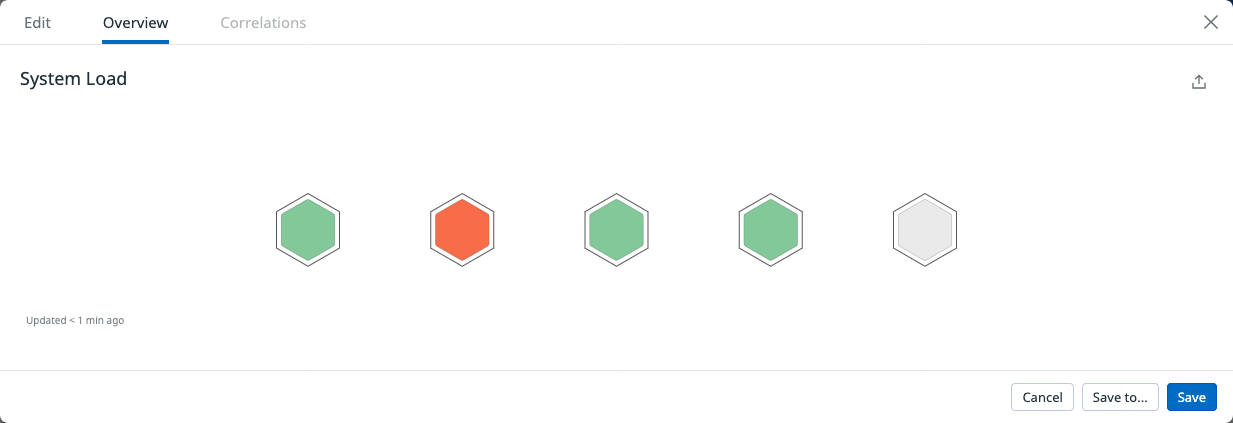
The 5-minute average system load per agent group.
| Metric | Description |
|---|---|
system.load.5 |
5-minute average system load. |
System Process Queue (Windows only)
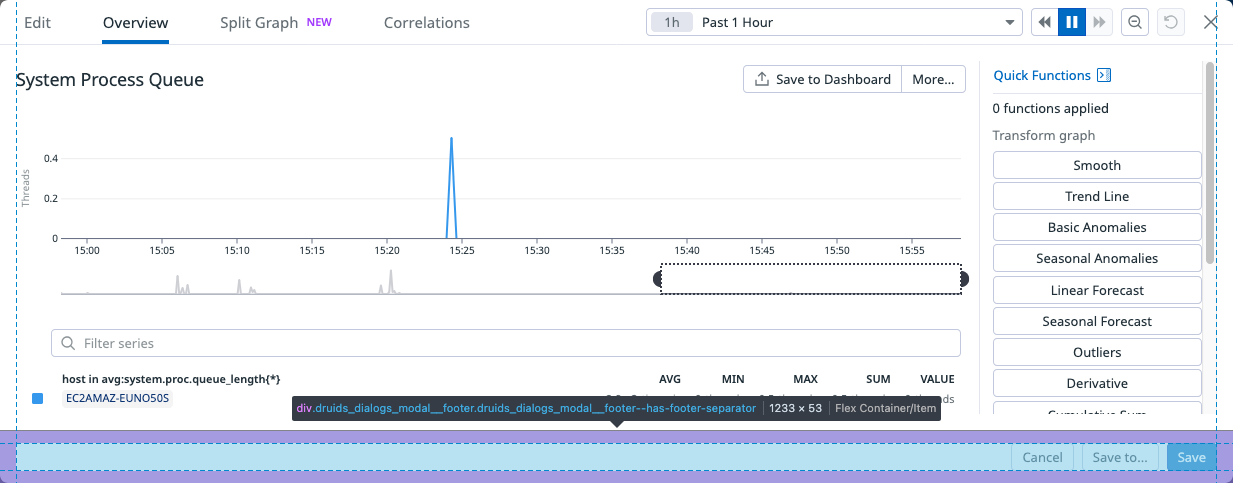
The average number of threads in the system process queue.
| Metric | Description |
|---|---|
system.proc.queue_length |
The number of threads that are observed as delayed in the processor ready queue and are waiting to be executed. |
Unsynced Operation Logs
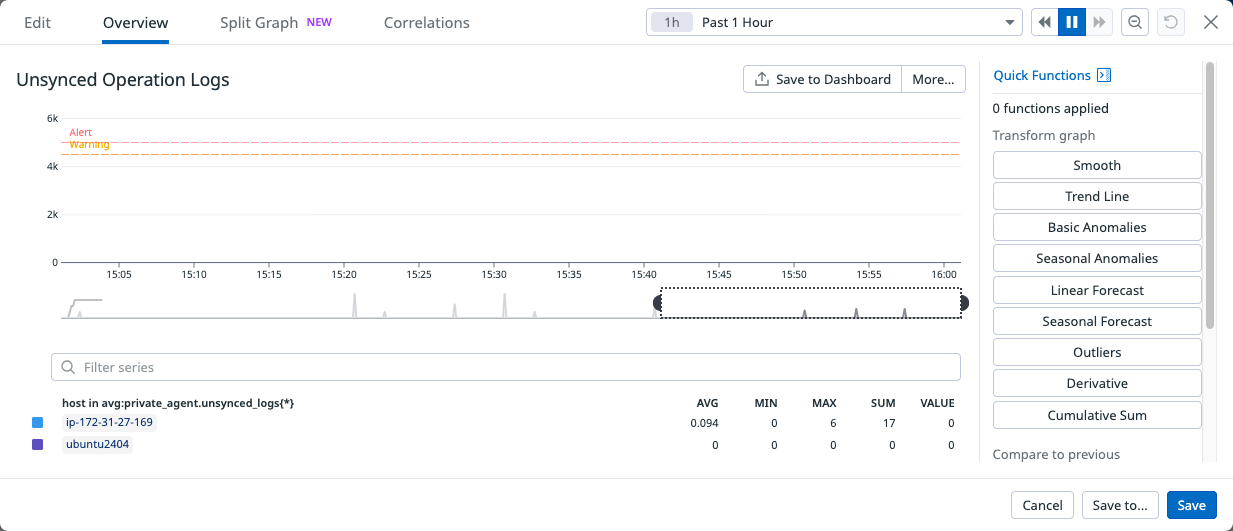
The number of unsynchronized agent operation logs, plotted by time.
| Metric | Description |
|---|---|
private_agent.unsynced_logs |
Number of unsynchronized agent operation logs. |
Incoming message queue by agent group
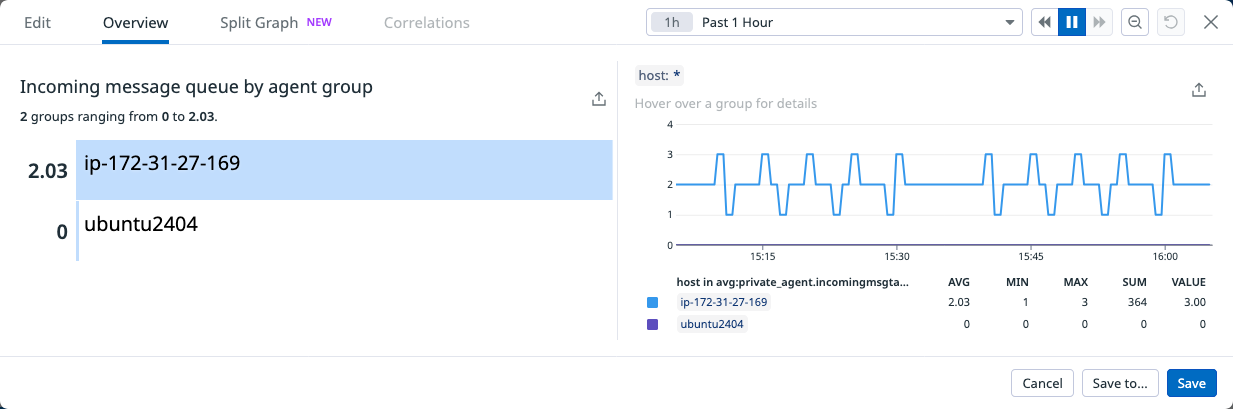
The number of operations in the queue waiting to be processed per agent group.
| Metric | Description |
|---|---|
private_agent.incomingmsgtab_count |
Number of queue-bound operations. |
Apache idle workers
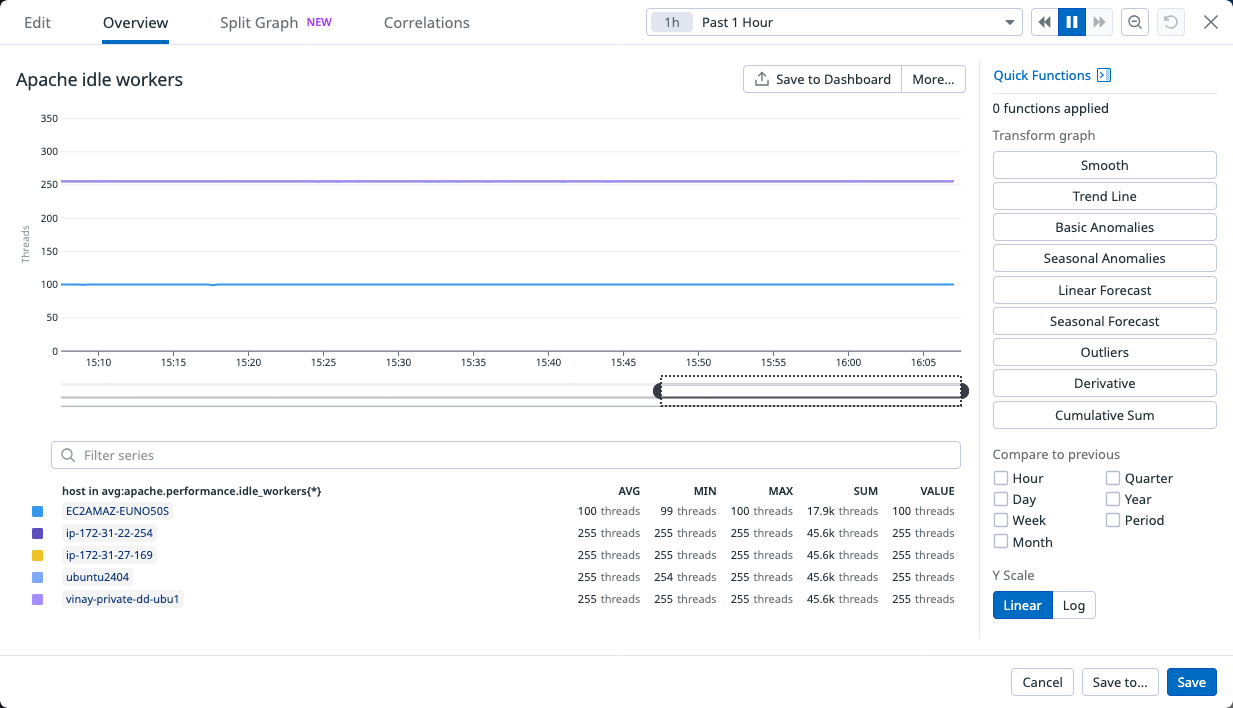
The number of idle Apache worker threads per agent host, plotted by time.
| Metric | Description |
|---|---|
apache.performance.idle_workers |
Number of idle worker threads in the agent's Apache web server. |
Apache busy workers
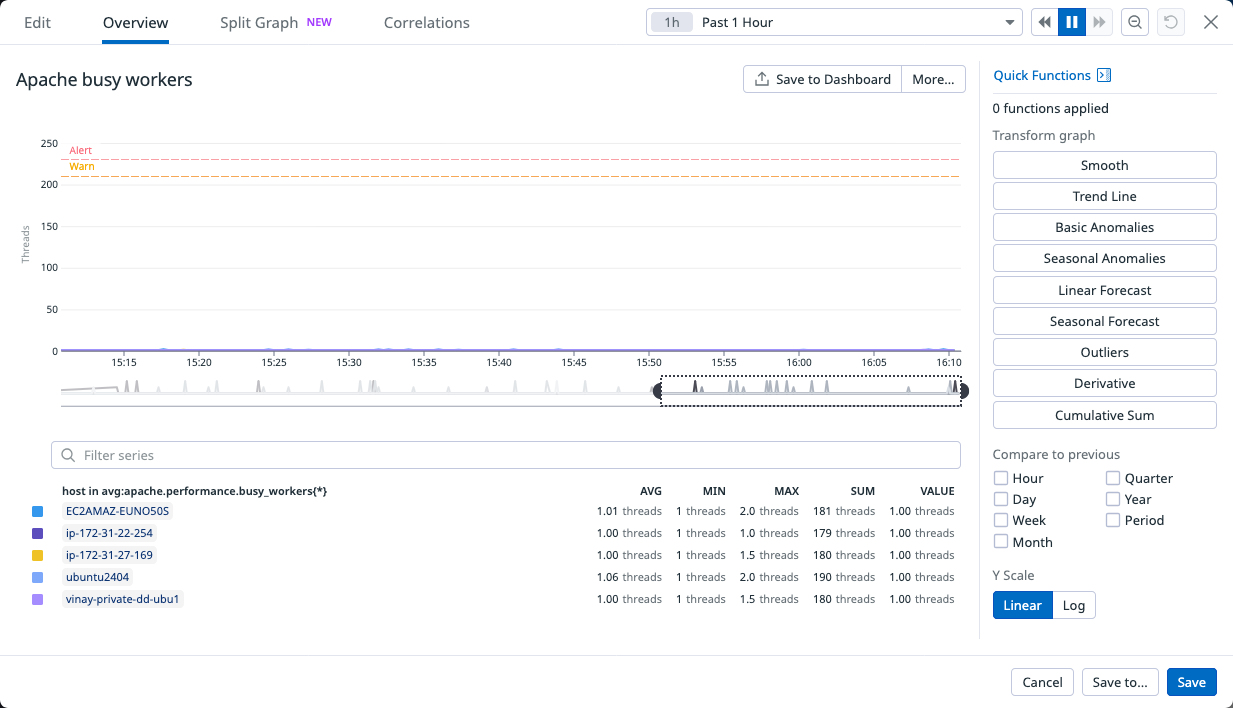
The number of busy Apache worker threads per agent host, plotted by time.
| Metric | Description |
|---|---|
apache.performance.busy_workers |
Number of busy worker threads in the agent's Apache web server. |
Postgres Connections
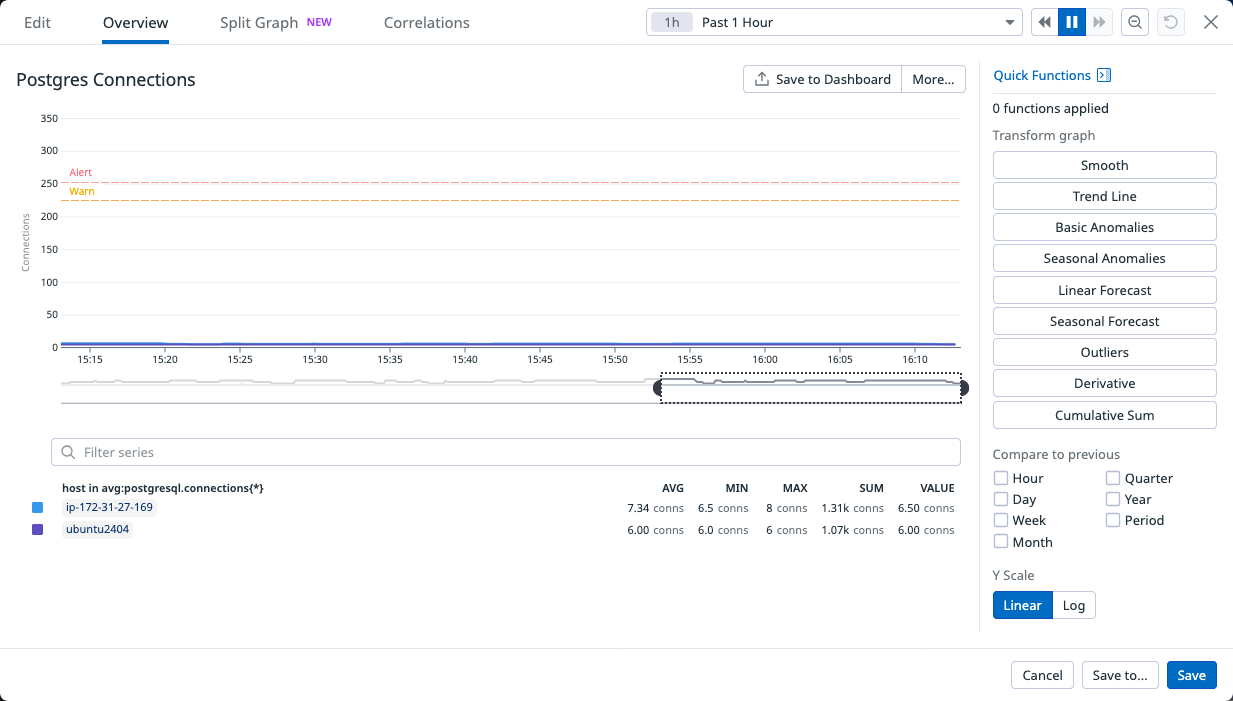
The number of active PostgreSQL database connections per agent host, plotted by time.
| Metric | Description |
|---|---|
postgresql.connections |
The number of active connections to this database. |
Postgres Rows fetched / returned / inserted / updated (per sec)
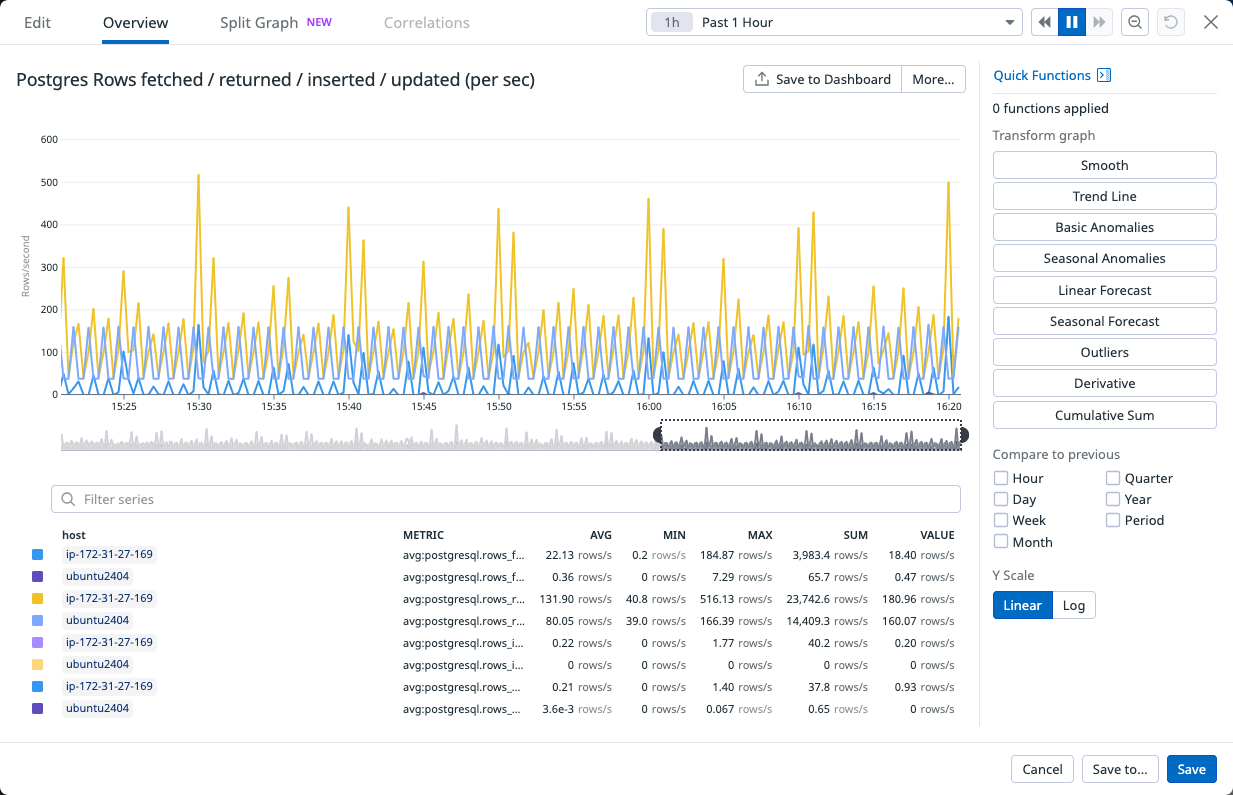
The number of rows fetched, returned, inserted, or updated per second by the agent's PostgreSQL database, plotted by time.
| Metric | Description |
|---|---|
postgresql.rows_fetched |
The number of rows fetched by queries in this database. |
postgresql.rows_returned |
The number of rows returned by queries in this database. |
postgresql.rows_inserted |
The number of rows inserted by queries in this database. |
postgresql.rows_updated |
The number of rows updated by queries in this database. |
Postgres - Inserts / updates / deletes (per sec)
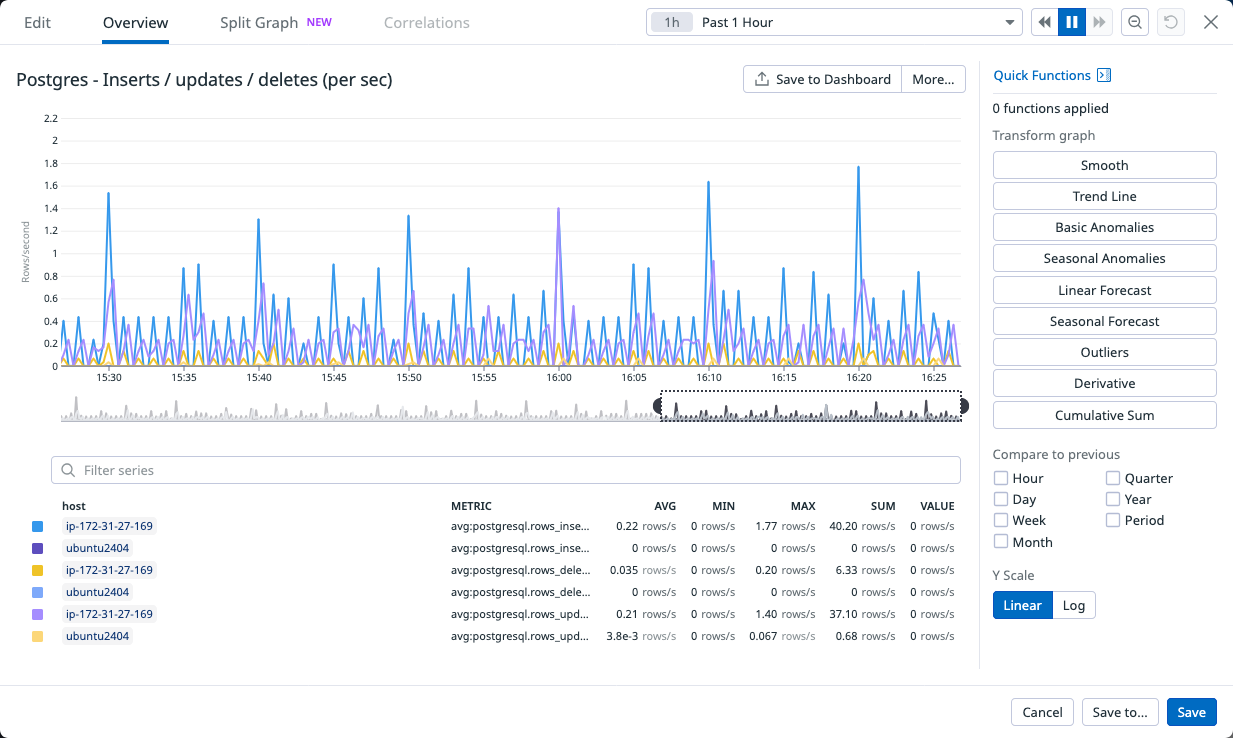
The number of rows inserted, updated, or deleted per second by the agent's PostgreSQL database, plotted by time.
| Metric | Description |
|---|---|
postgresql.rows_inserted |
The number of rows inserted by queries in this database. |
postgresql.rows_updated |
The number of rows updated by queries in this database. |
postgresql.rows_deleted |
The number of rows deleted by queries in this database. |
Postgres - Deadlocks per database
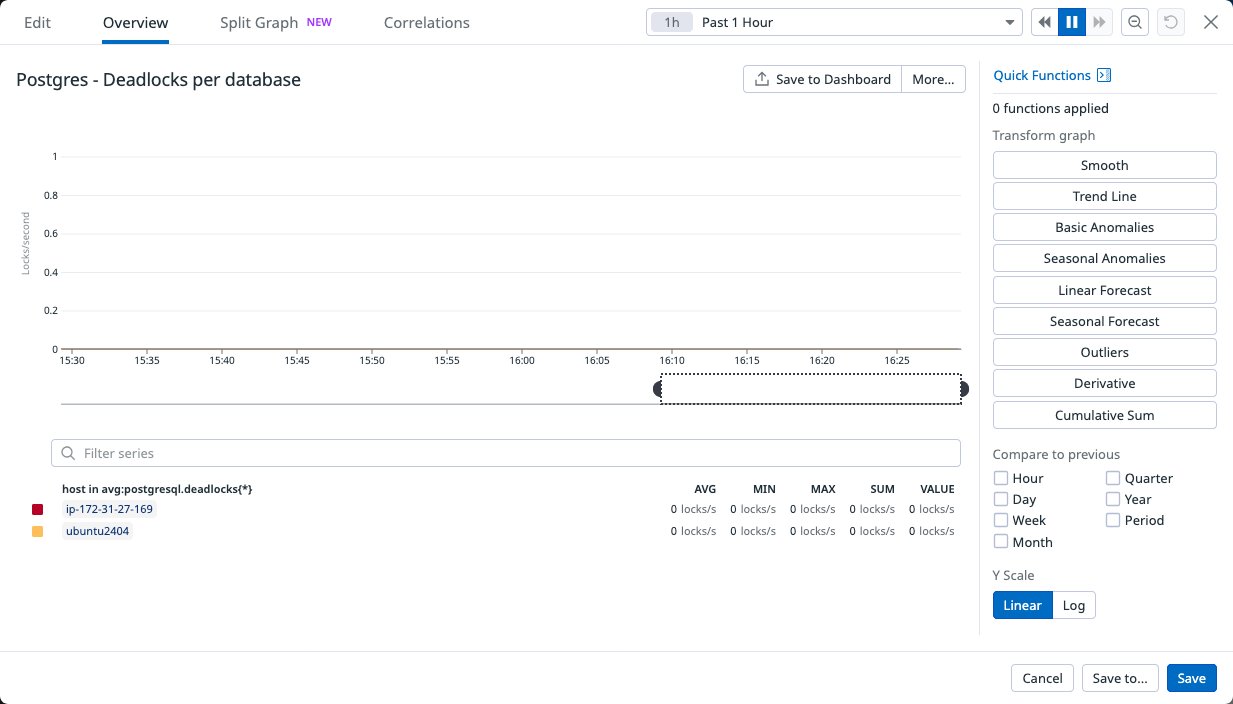
The number of PostgreSQL database deadlocks per agent host, plotted by time.
| Metric | Description |
|---|---|
postgresql.deadlocks |
The rate of deadlocks detected in this database. |
Agent CPU Average

The percentage of time the CPU spends on average in user and kernel space processes, per agent host, plotted by time.
| Metric | Description |
|---|---|
system.cpu.user |
The percent of time the CPU spent running user space processes. |
system.cpu.system |
The percent of time the CPU spent running the kernel. |
Agent CPU Max
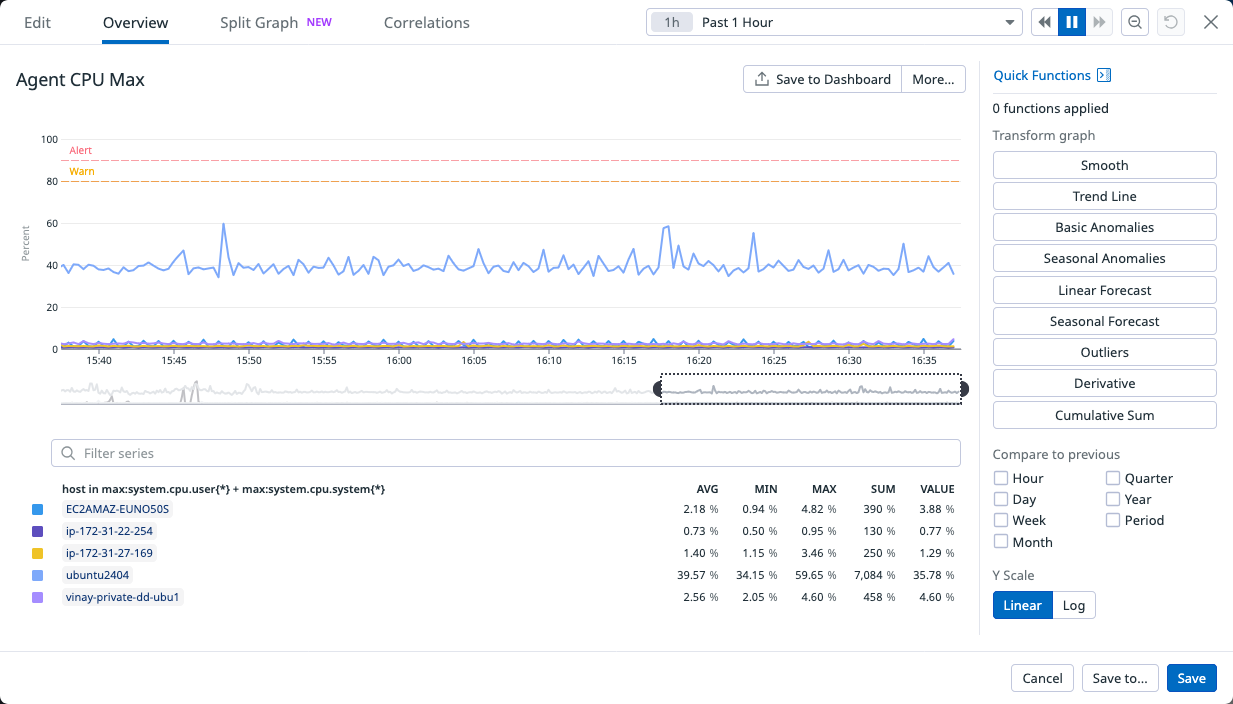
The percentage of time the CPU spends in user and kernel space processes, per agent host, plotted by time.
| Metric | Description |
|---|---|
system.cpu.user |
The percent of time the CPU spent running user space processes. |
system.cpu.system |
The percent of time the CPU spent running the kernel. |
Percentage of memory used
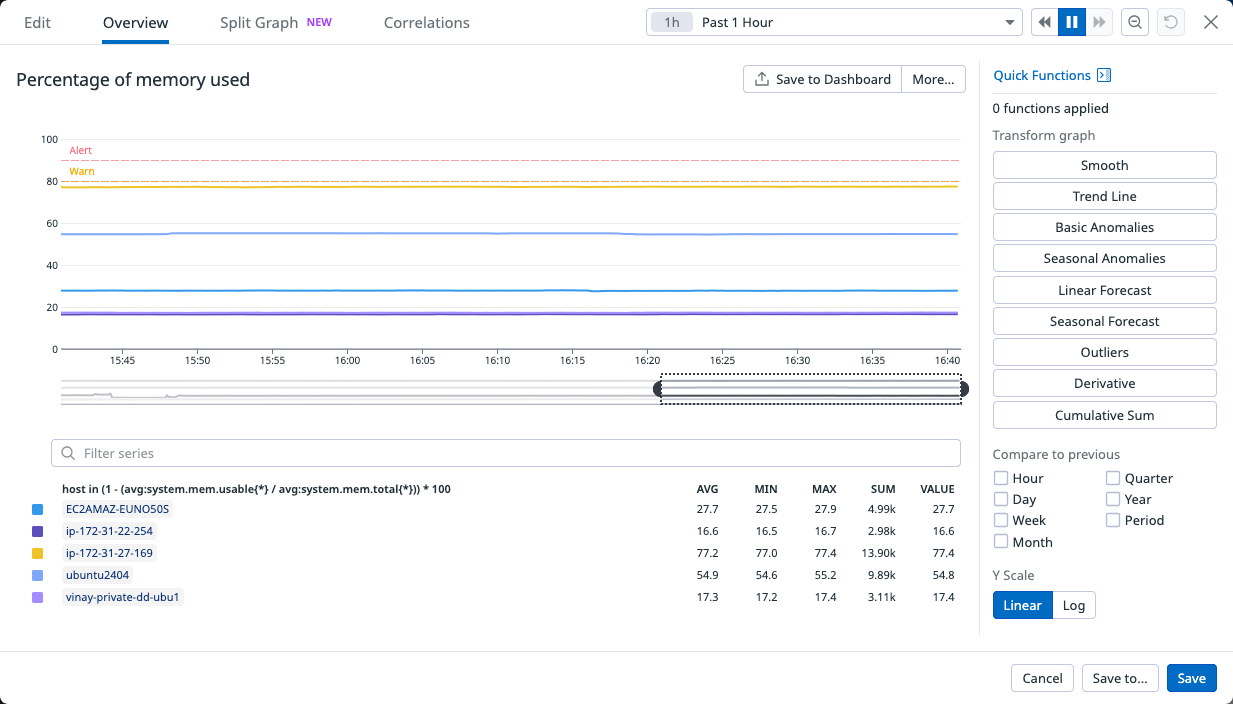
The percentage of used to total memory, per agent host, plotted by time.
| Metric | Description |
|---|---|
system.mem.total |
The total amount of physical RAM. |
system.mem.usable |
Value of MemAvailable from /proc/meminfo if present, but falls back to adding free + buffered + cached memory if not. |
Network IO
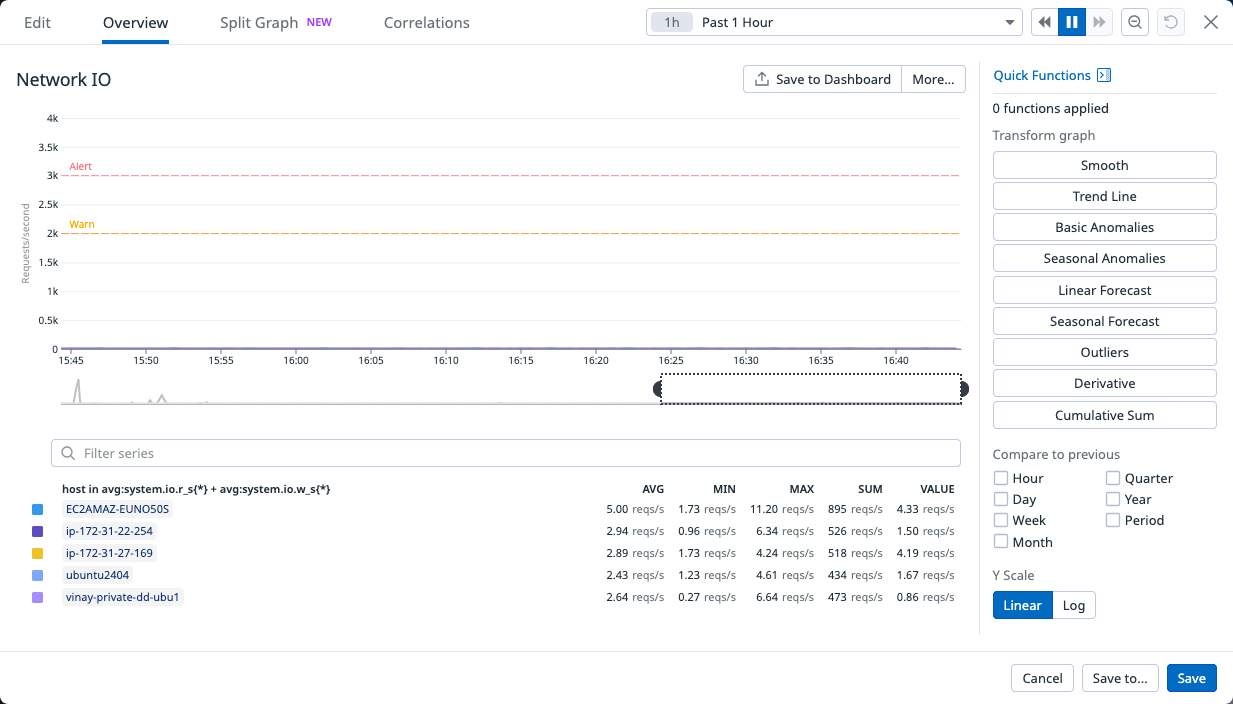
The number of read and write requests, per agent host, plotted by time.
| Metric | Description |
|---|---|
system.io.r_s |
The number of read requests issued to the device per second. |
system.io.w_s |
The number of write requests issued to the device per second. |
Network traffic received (per sec)
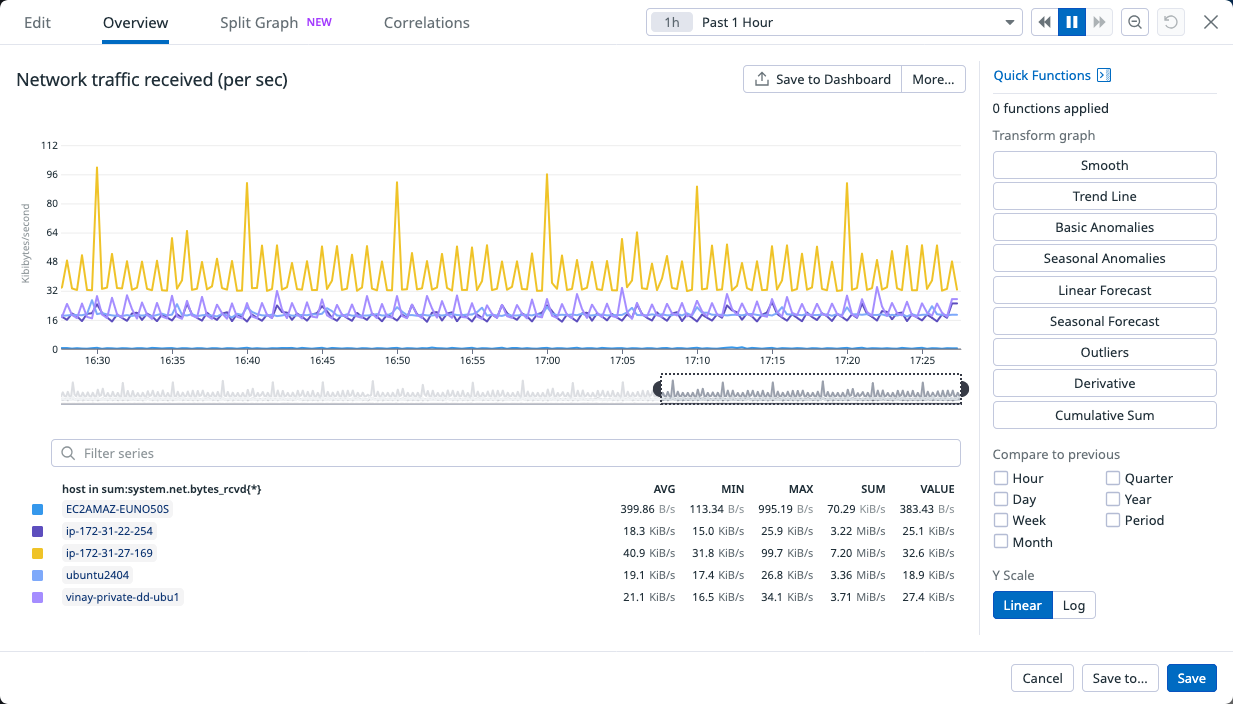
The number of kilobytes per second received, per agent host, plotted by time.
| Metric | Description |
|---|---|
system.net.bytes_rcvd |
The number of bytes received on a device per second. |
Network traffic sent (per sec)
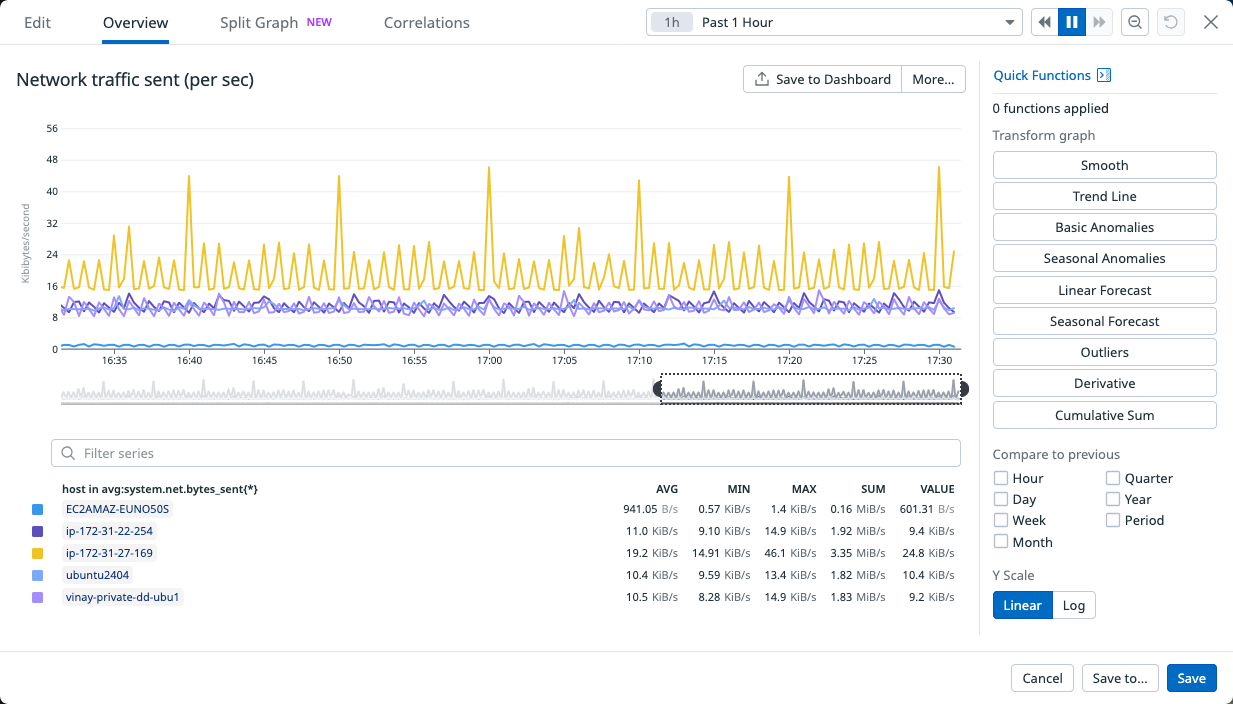
The number of kilobytes per second sent, per agent host, plotted by time.
| Metric | Description |
|---|---|
system.net.bytes_sent |
The number of bytes sent from a device per second. |
Disk Space % used
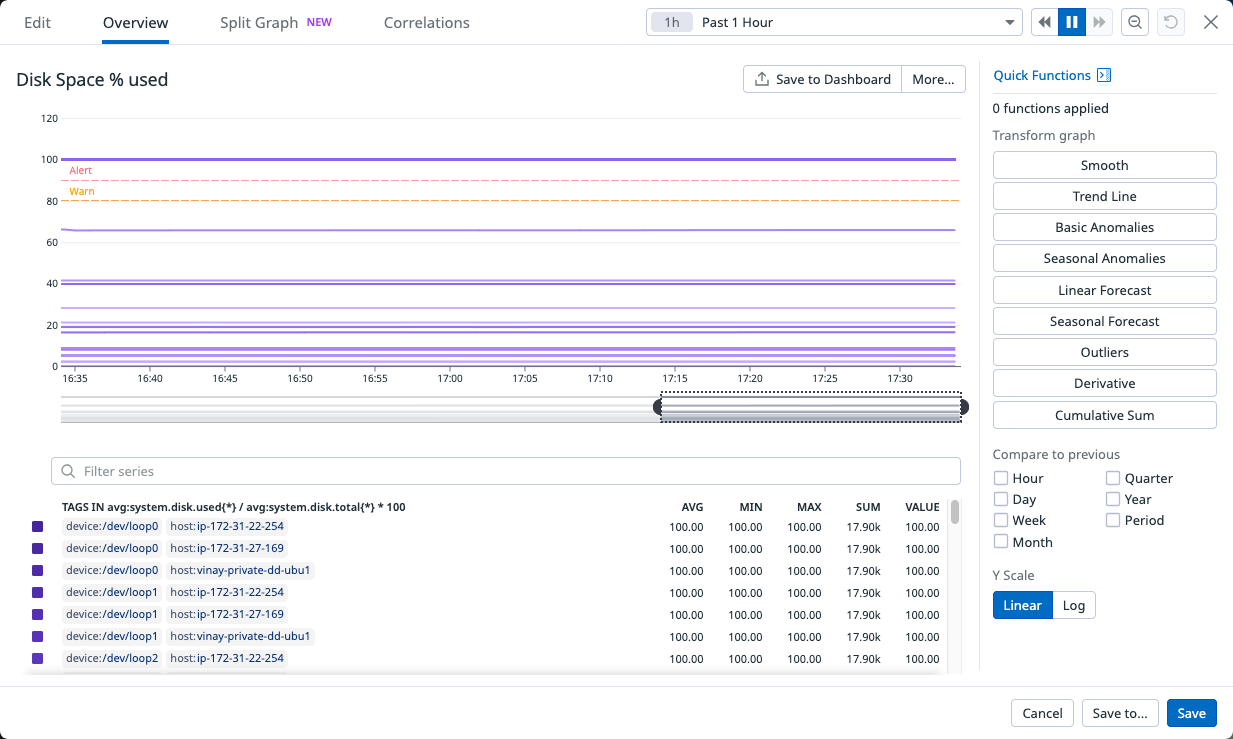
The amount of disk space used per device, plotted by time.
| Metric | Description |
|---|---|
system.disk.used |
The amount of disk space in use. |
system.disk.total |
The total amount of disk space. |
Disk utilization (%) (Linux only)
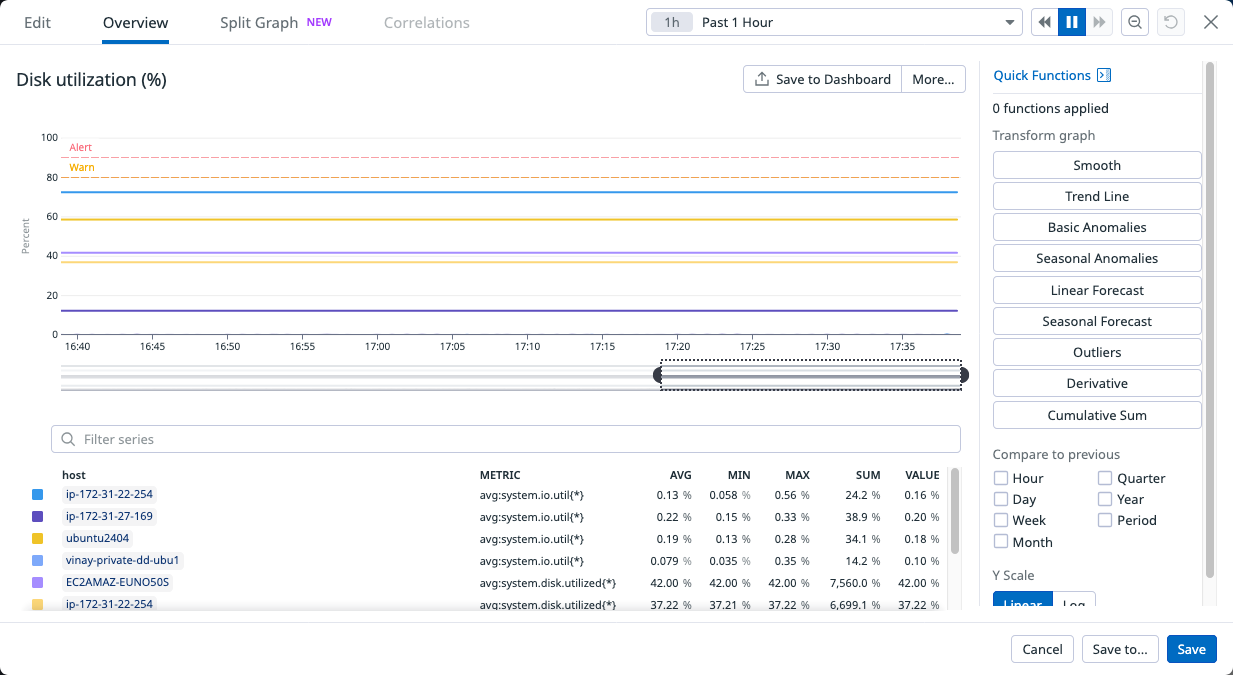
The percentage of disk space utilization, per agent host, plotted by time.
| Metric | Description |
|---|---|
system.io.util |
The percent of CPU time during which I/O requests were issued to the device. |
system.disk.utilized |
The amount of disk space in use as a percentage of the total. |
Disk read time
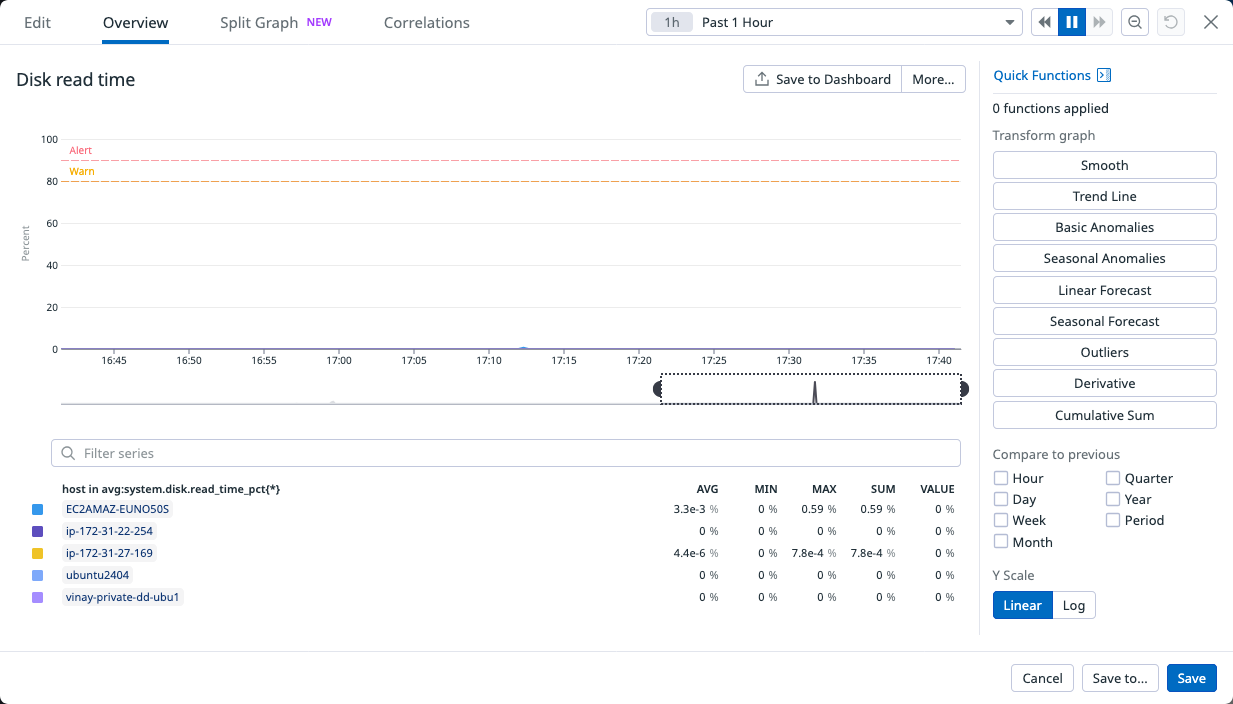
The percentage of time spent reading the disk, per agent host, plotted by time.
| Metric | Description |
|---|---|
system.disk.read_time_pct |
Percent of time spent reading from disk. |
Disk write time
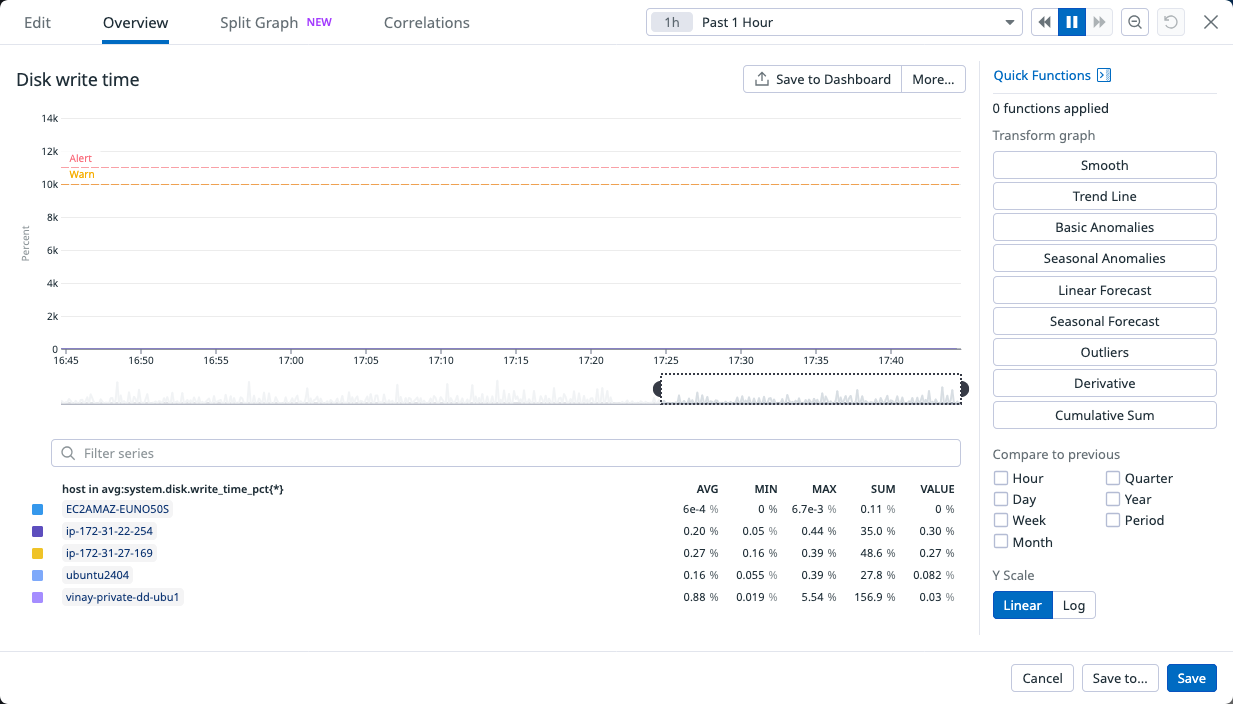
The percentage of time spent writing to the disk, per agent host, plotted by time.
| Metric | Description |
|---|---|
system.disk.write_time_pct |
Percent of time spent writing to disk. |
Java Heap Memory
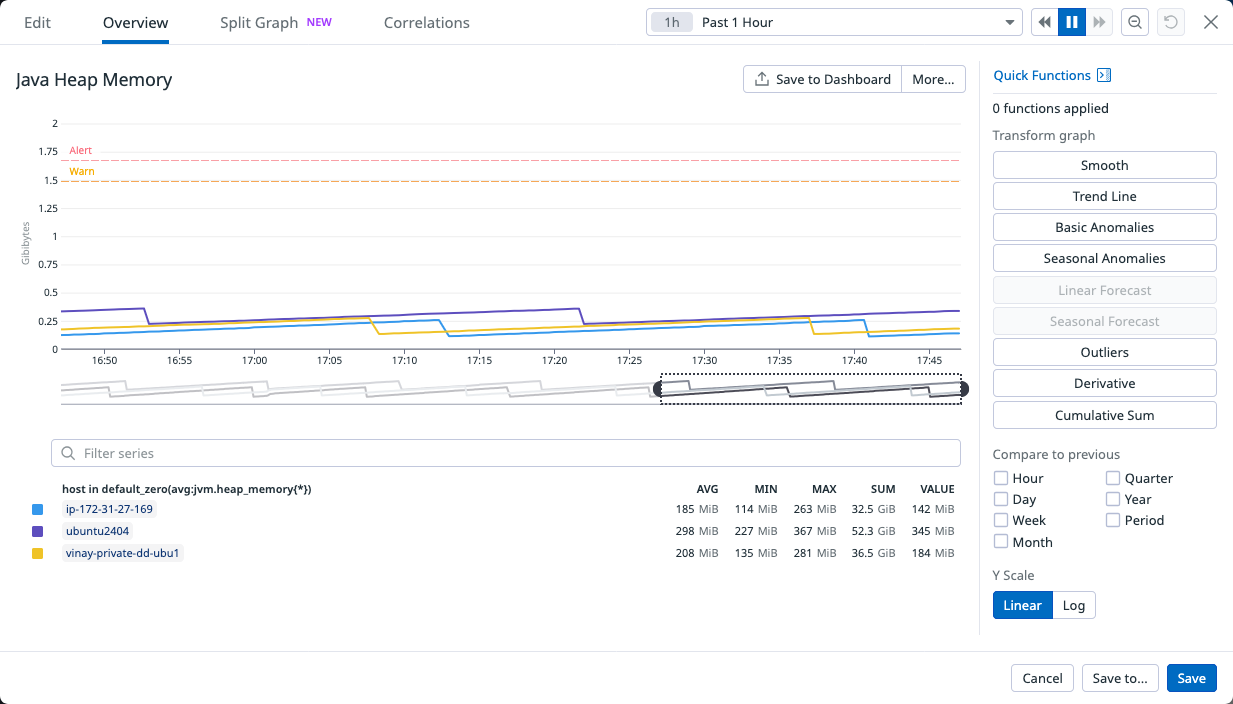
The total amount of Java heap memory, per agent host, plotted by time.
| Metric | Description |
|---|---|
jvm.heap_memory |
The total Java heap memory used. |
JVM thread count
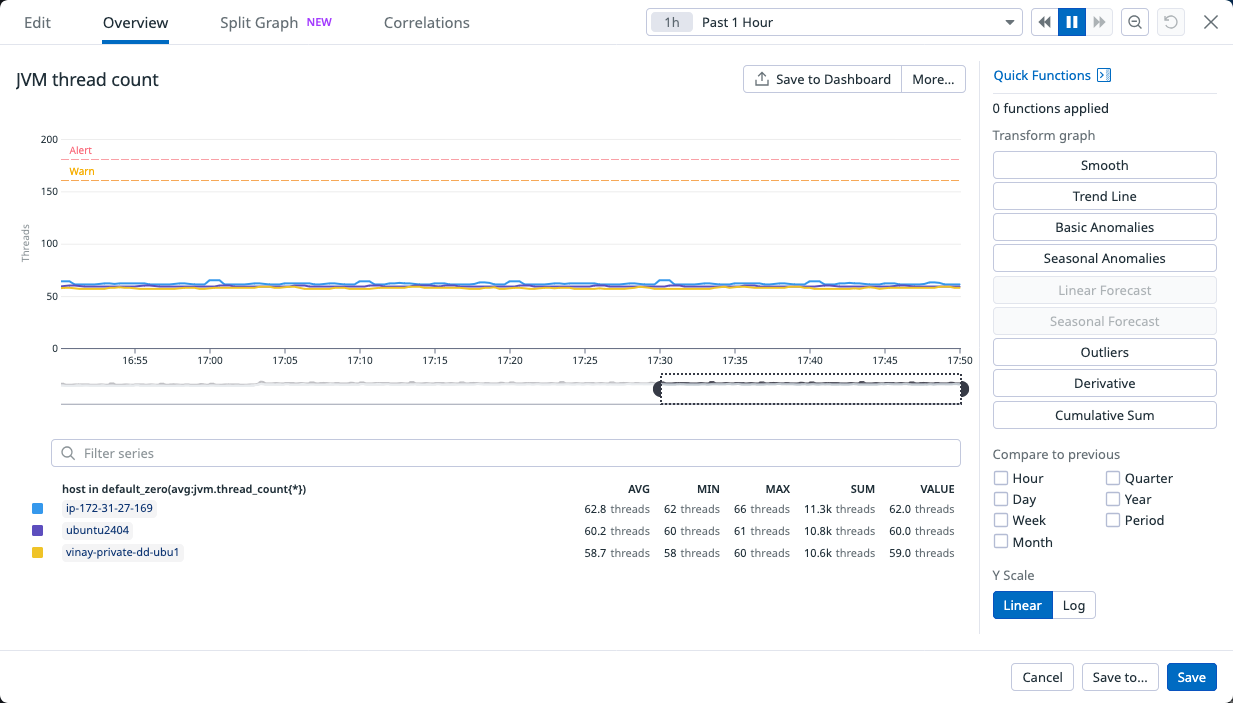
Number of JVM threads, per agent host, plotted by time.
| Metric | Description |
|---|---|
jvm.thread_count |
The number of live threads. |
Incoming MessageTab by Group
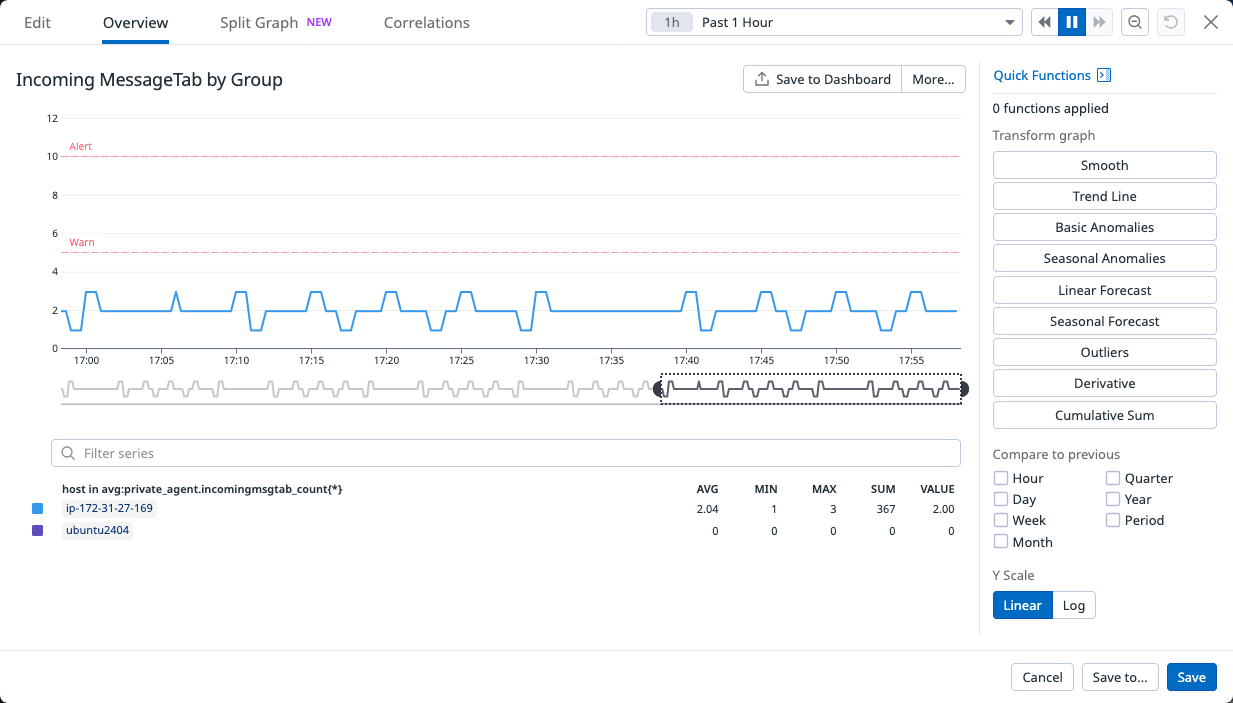
Number of items in the agent's PostgreSQL messagestab table, by agent host, plotted by time.
| Metric | Description |
|---|---|
private_agent.incomingmsgtab_count |
Number of rows in TranDb.messagestab. |
OperationsEngine Processes
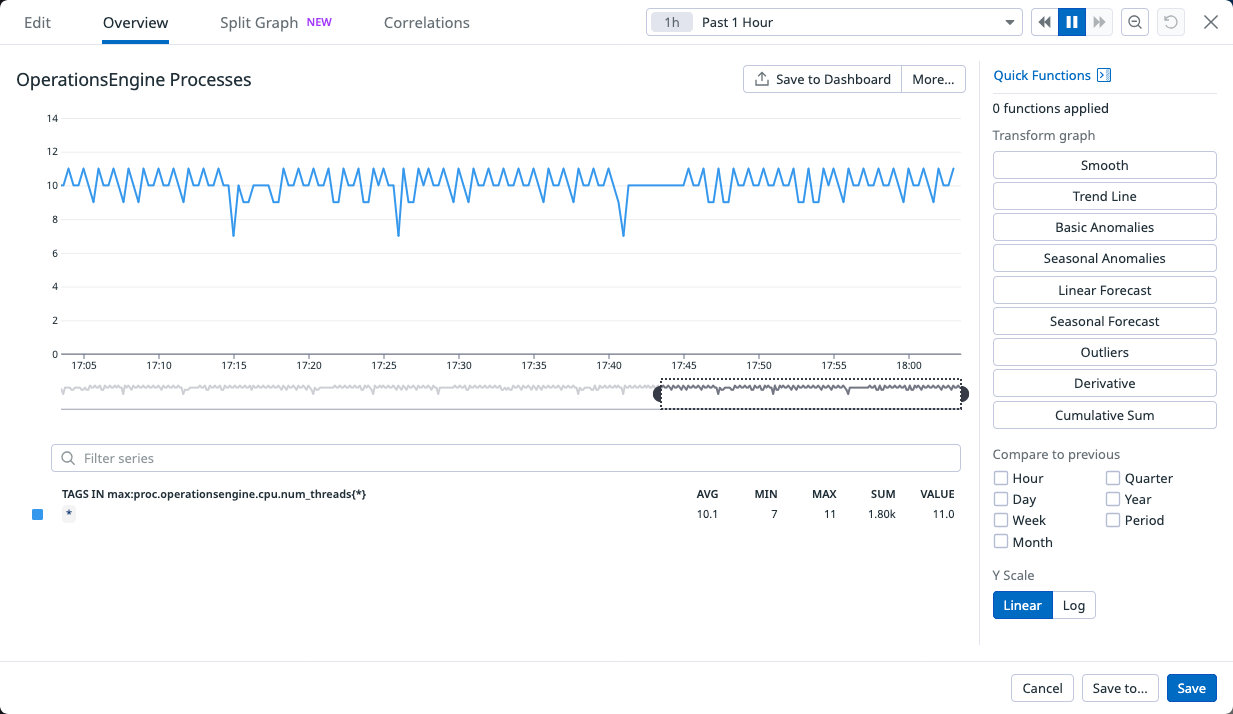
Number of operations engine processes, plotted by time.
| Metric | Description |
|---|---|
proc.operationsengine.cpu.num_threads |
Number of CPU threads used by the operations engine. |
Operations by agent (top 25)
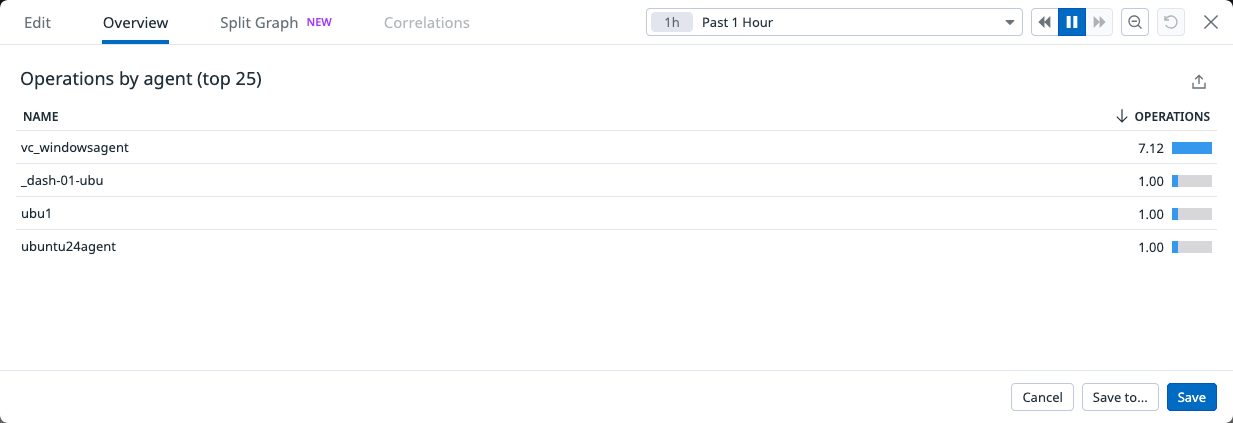
The top 25 agents by number of operations.
| Metric | Description |
|---|---|
proc.openginebyname.cpu.num_threads |
Number of CPU threads used by the operations engine per agent. |
Agent Services Client Active Connections
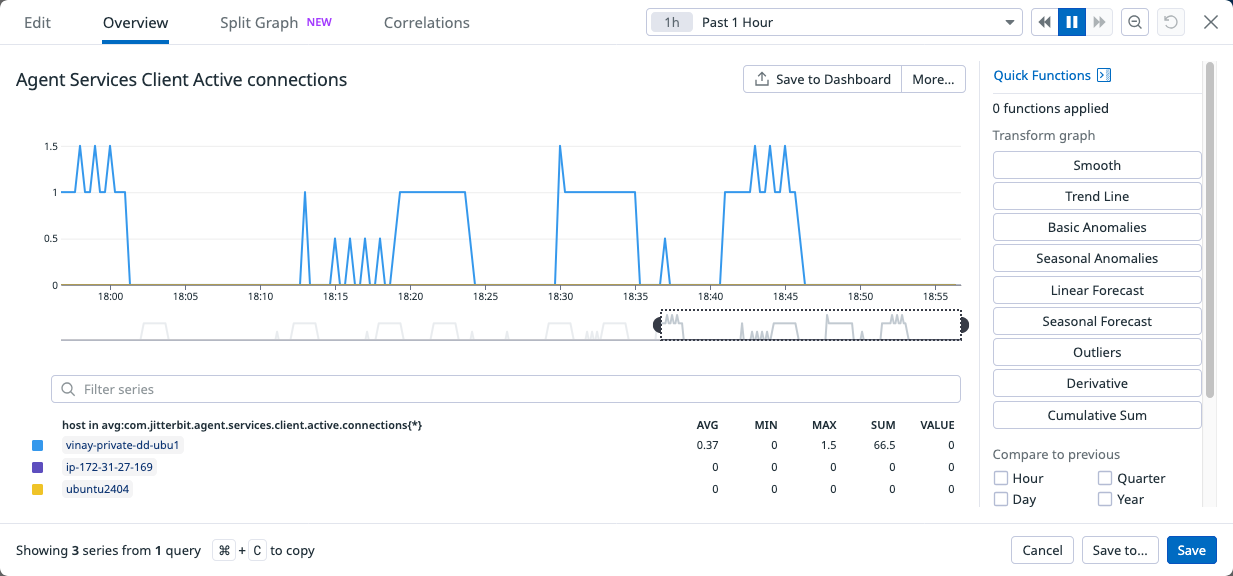
Number of active client connections per agent, plotted by time.
| Metric | Description |
|---|---|
com.jitterbit.agent.services.client.active.connections |
Number of active client connections. |
Agent Services Client Max Connections
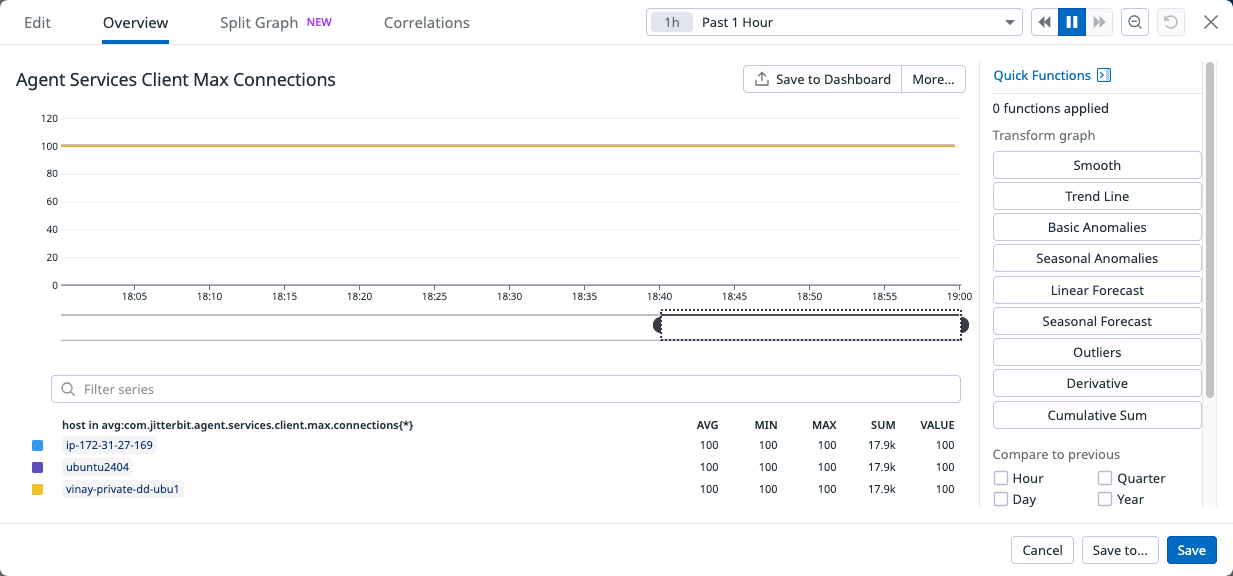
Maximum number of allowed client connections per agent, plotted by time.
| Metric | Description |
|---|---|
com.jitterbit.agent.services.client.max.connections |
Maximum number of allowed active client connections. |
Agent Services Client Available Connections
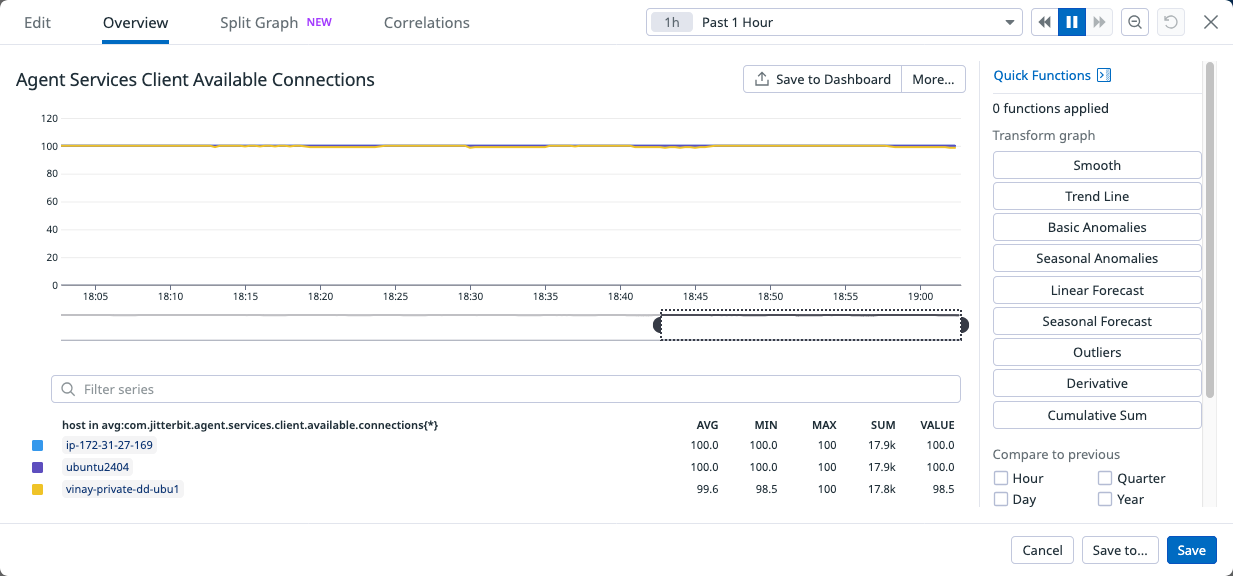
Number of available client connections per agent, plotted by time.
| Metric | Description |
|---|---|
com.jitterbit.agent.services.client.available.connections |
Number of available client connections. |
Rest Client Active Connections
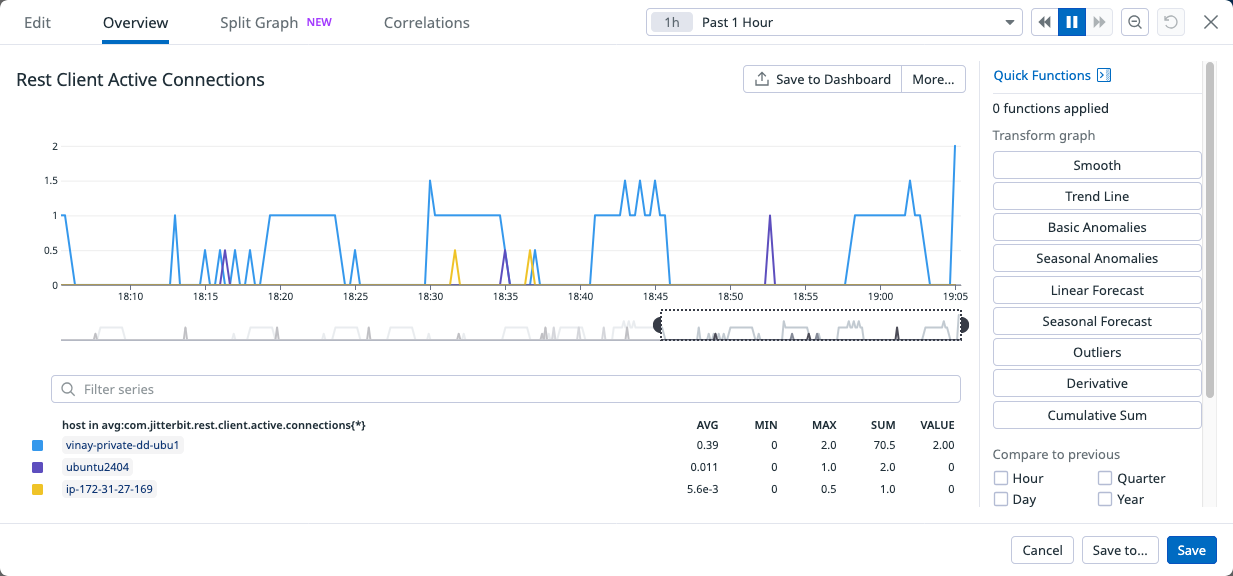
Number of active client REST connections per agent, plotted by time.
| Metric | Description |
|---|---|
com.jitterbit.rest.client.active.connections |
Number of active REST client connections. |
Rest Client Max Connections

Maximum number of allowed client REST connections per agent, plotted by time.
| Metric | Description |
|---|---|
com.jitterbit.rest.client.max.connections |
Maximum number of allowed REST client connections. |
Rest Client Idle Connections
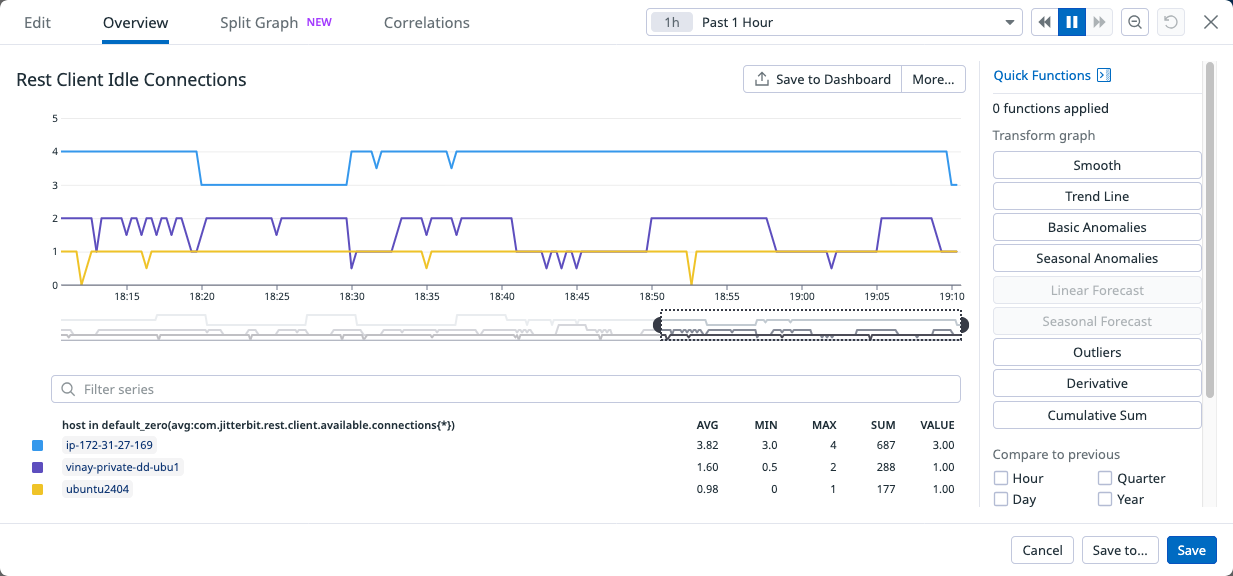
Number of idle client REST connections per agent, plotted by time.
| Metric | Description |
|---|---|
com.jitterbit.rest.client.available.connections |
Number of available REST client connections. |
Rest Client Local Active Connections
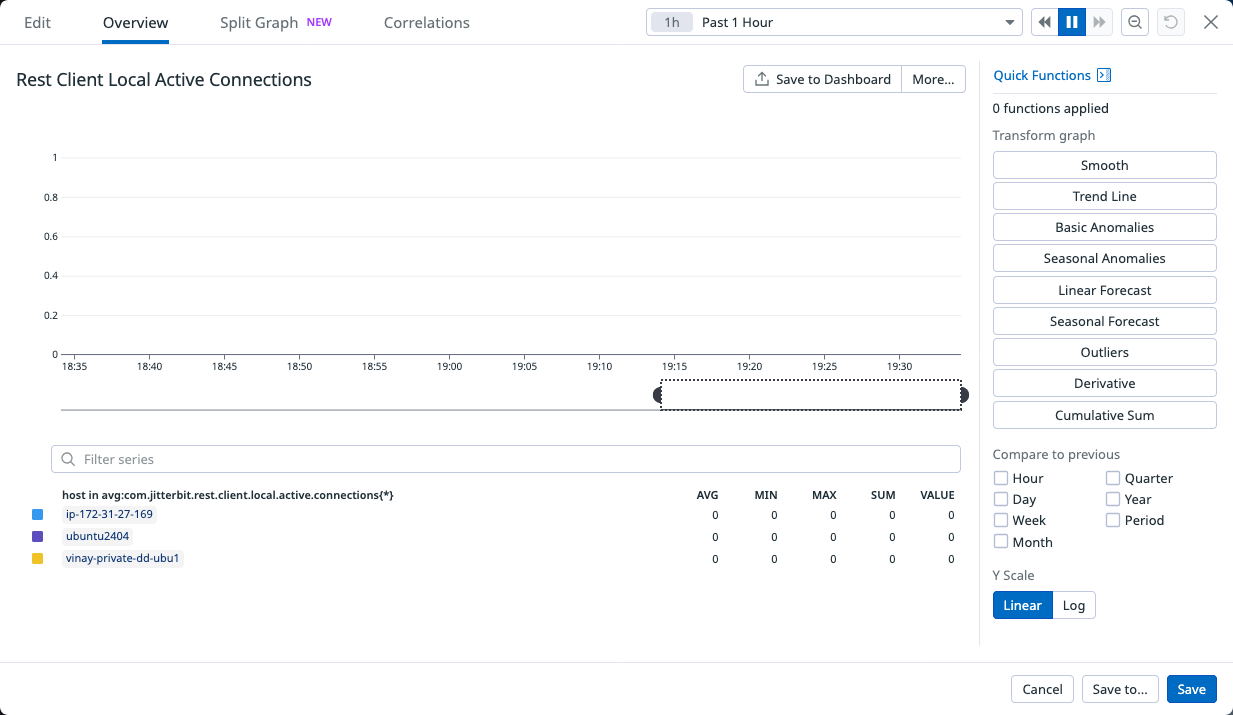
Number of active local client REST connections per agent, plotted by time.
| Metric | Description |
|---|---|
com.jitterbit.rest.client.local.active.connections |
Number of active local REST client connections. |
Rest Client Local Max Connections
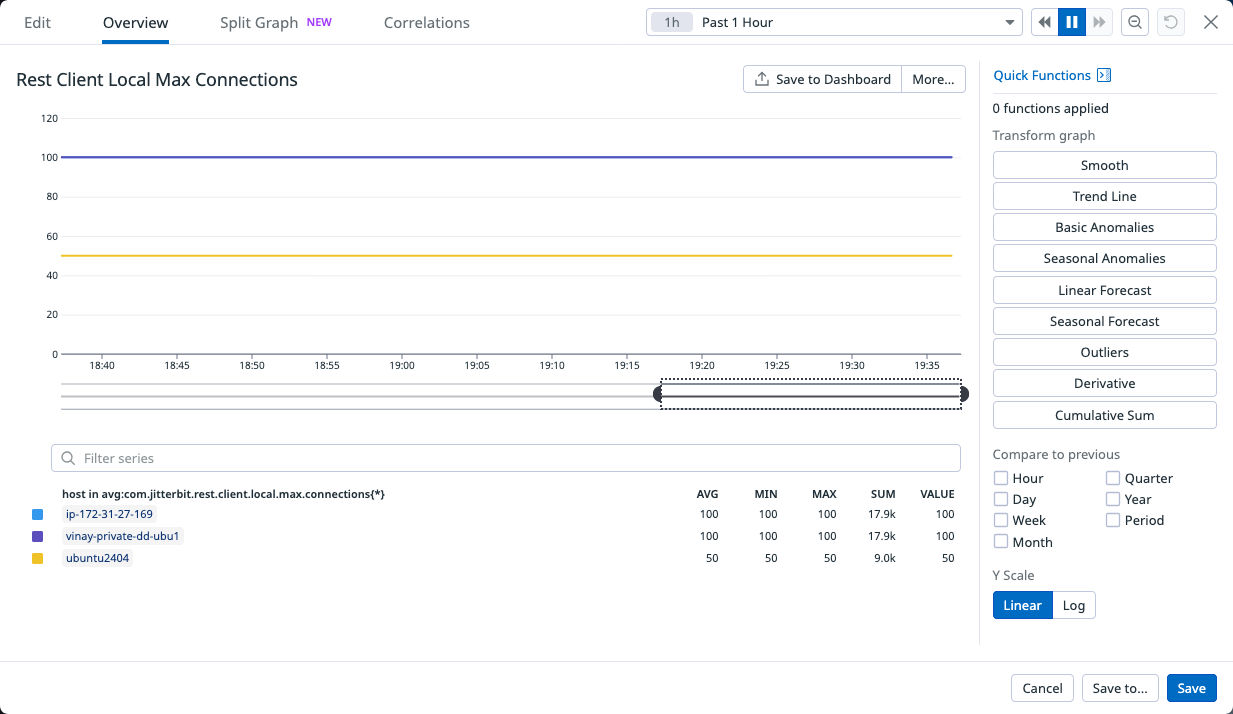
Maximum number of allowed local client REST connections per agent, plotted by time.
| Metric | Description |
|---|---|
com.jitterbit.rest.client.local.max.connections |
Maximum number of allowed local REST client connections. |
Rest Client Local Idle Connections
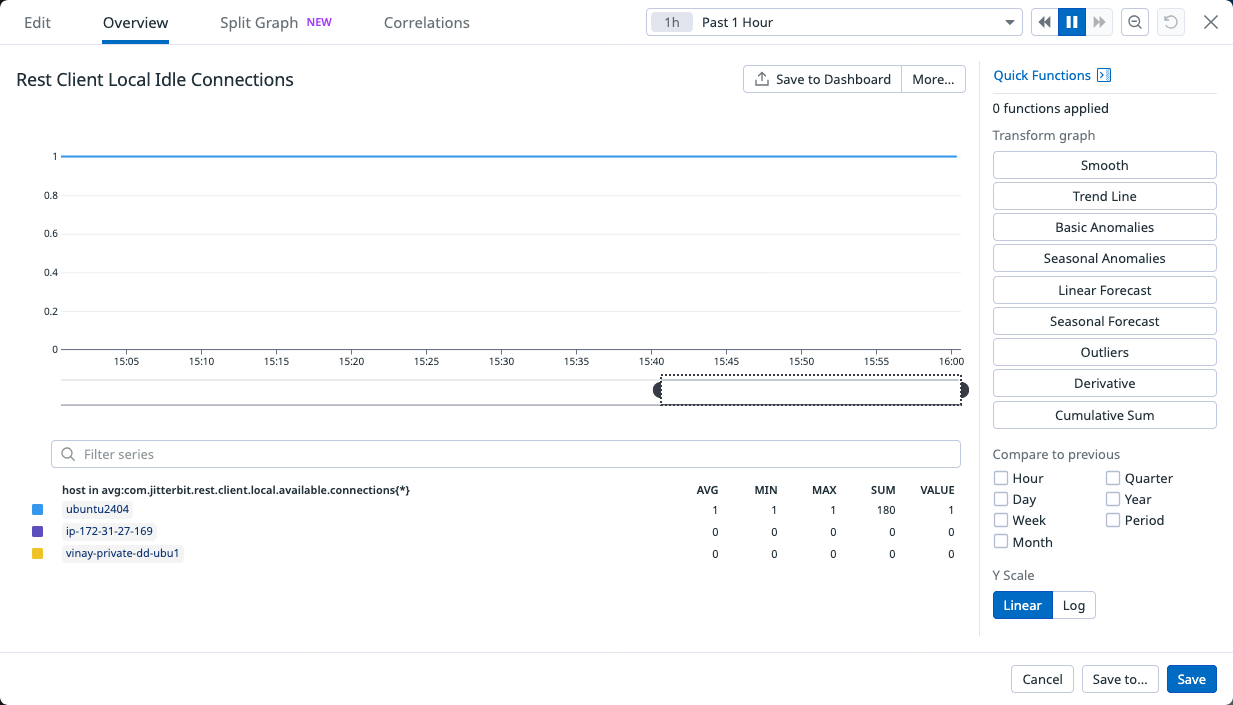
Number of available local client REST connections per agent, plotted by time.
| Metric | Description |
|---|---|
com.jitterbit.rest.client.local.available.connections |
Number of available local REST client connections. |
Operations Running Over Schedule
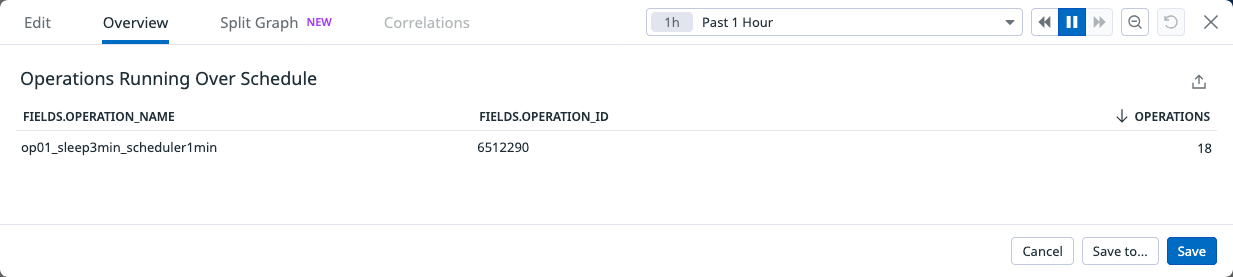
A list of operations that have run over schedule, and how many times each has.
| Metric | Description |
|---|---|
metric.operation.runing.over.scheduled.interval |
Names of operations running over schedule. |
Submitted Operations Waiting to Run
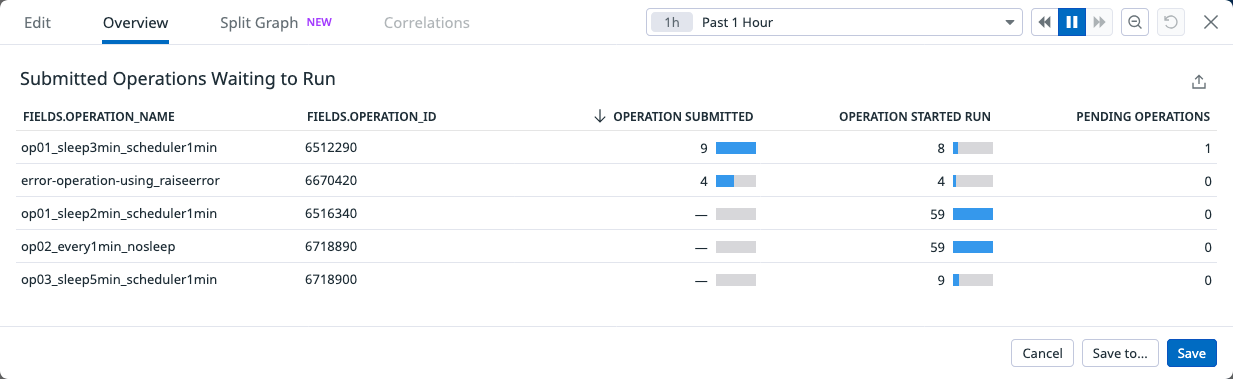
Operations submitted but not yet started. (The Pending Operations column shows how many operation instances are pending in Submitted status.)
| Metric | Description |
|---|---|
metric.operation.count.by.status |
Number of operations per status. |
Operation Duration
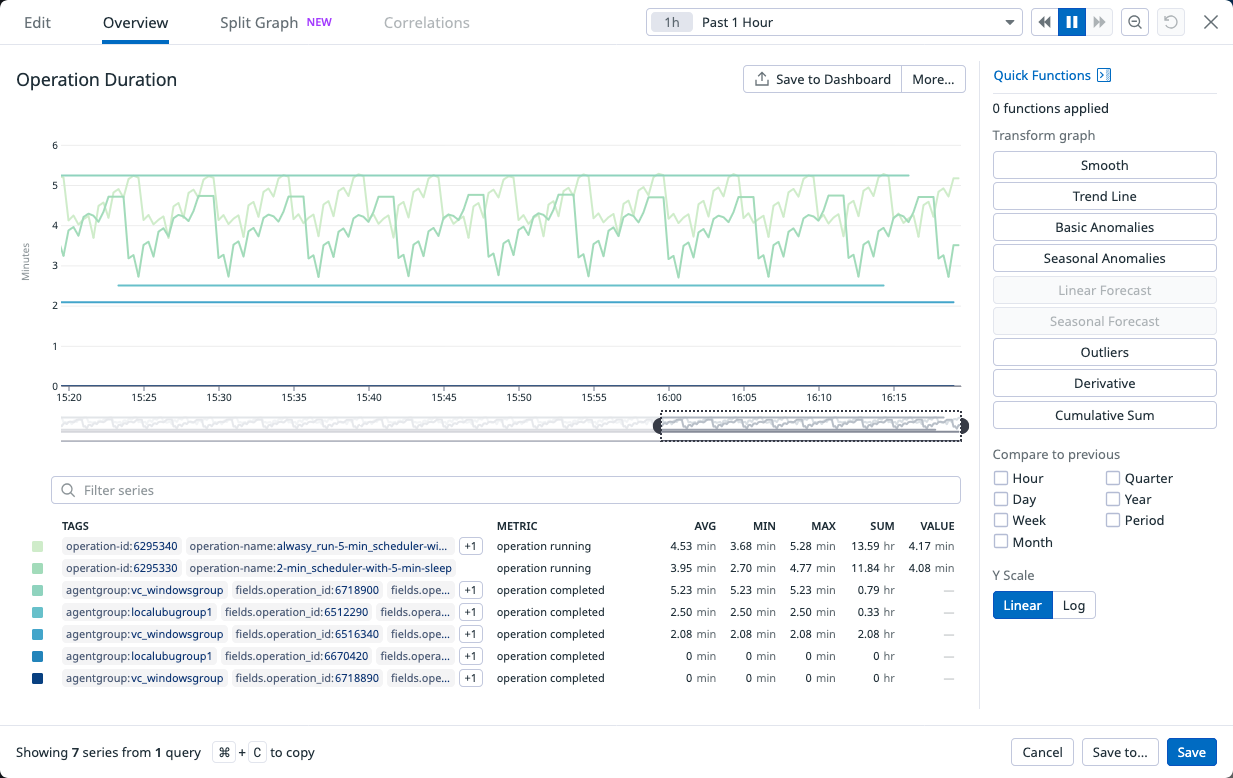
Operation completion duration, and the current interval of an operation instance run, by operation ID, plotted by time.
This chart shows if an operation instance is taking more than the average amount of time the operation takes to finish.
Note
If there are changes to the operation that increase the running time, the average operation duration will be initially skewed, but should correct itself over time.
| Metric | Description |
|---|---|
private_agent.operation_run_time_seconds |
How long the operation has been running for. |
metric.operation.duration.seconds |
The average operation run time. |