Request Inspector page in Jitterbit App Builder
Introduction
The Request Inspector page contains summarized information about the current URL and HTTP headers.
Note
This page was added in App Builder 4.45.
Another way to obtain information about the current HTTP request is by using the Request() function.
Access the Request Inspector page
To access the Request Inspector page, follow these steps:
-
Go to IDE > Security Providers.
-
In the Configuration panel, click More and select Inspect Request.
Page details
The Request Inspector page displays the following user interface:
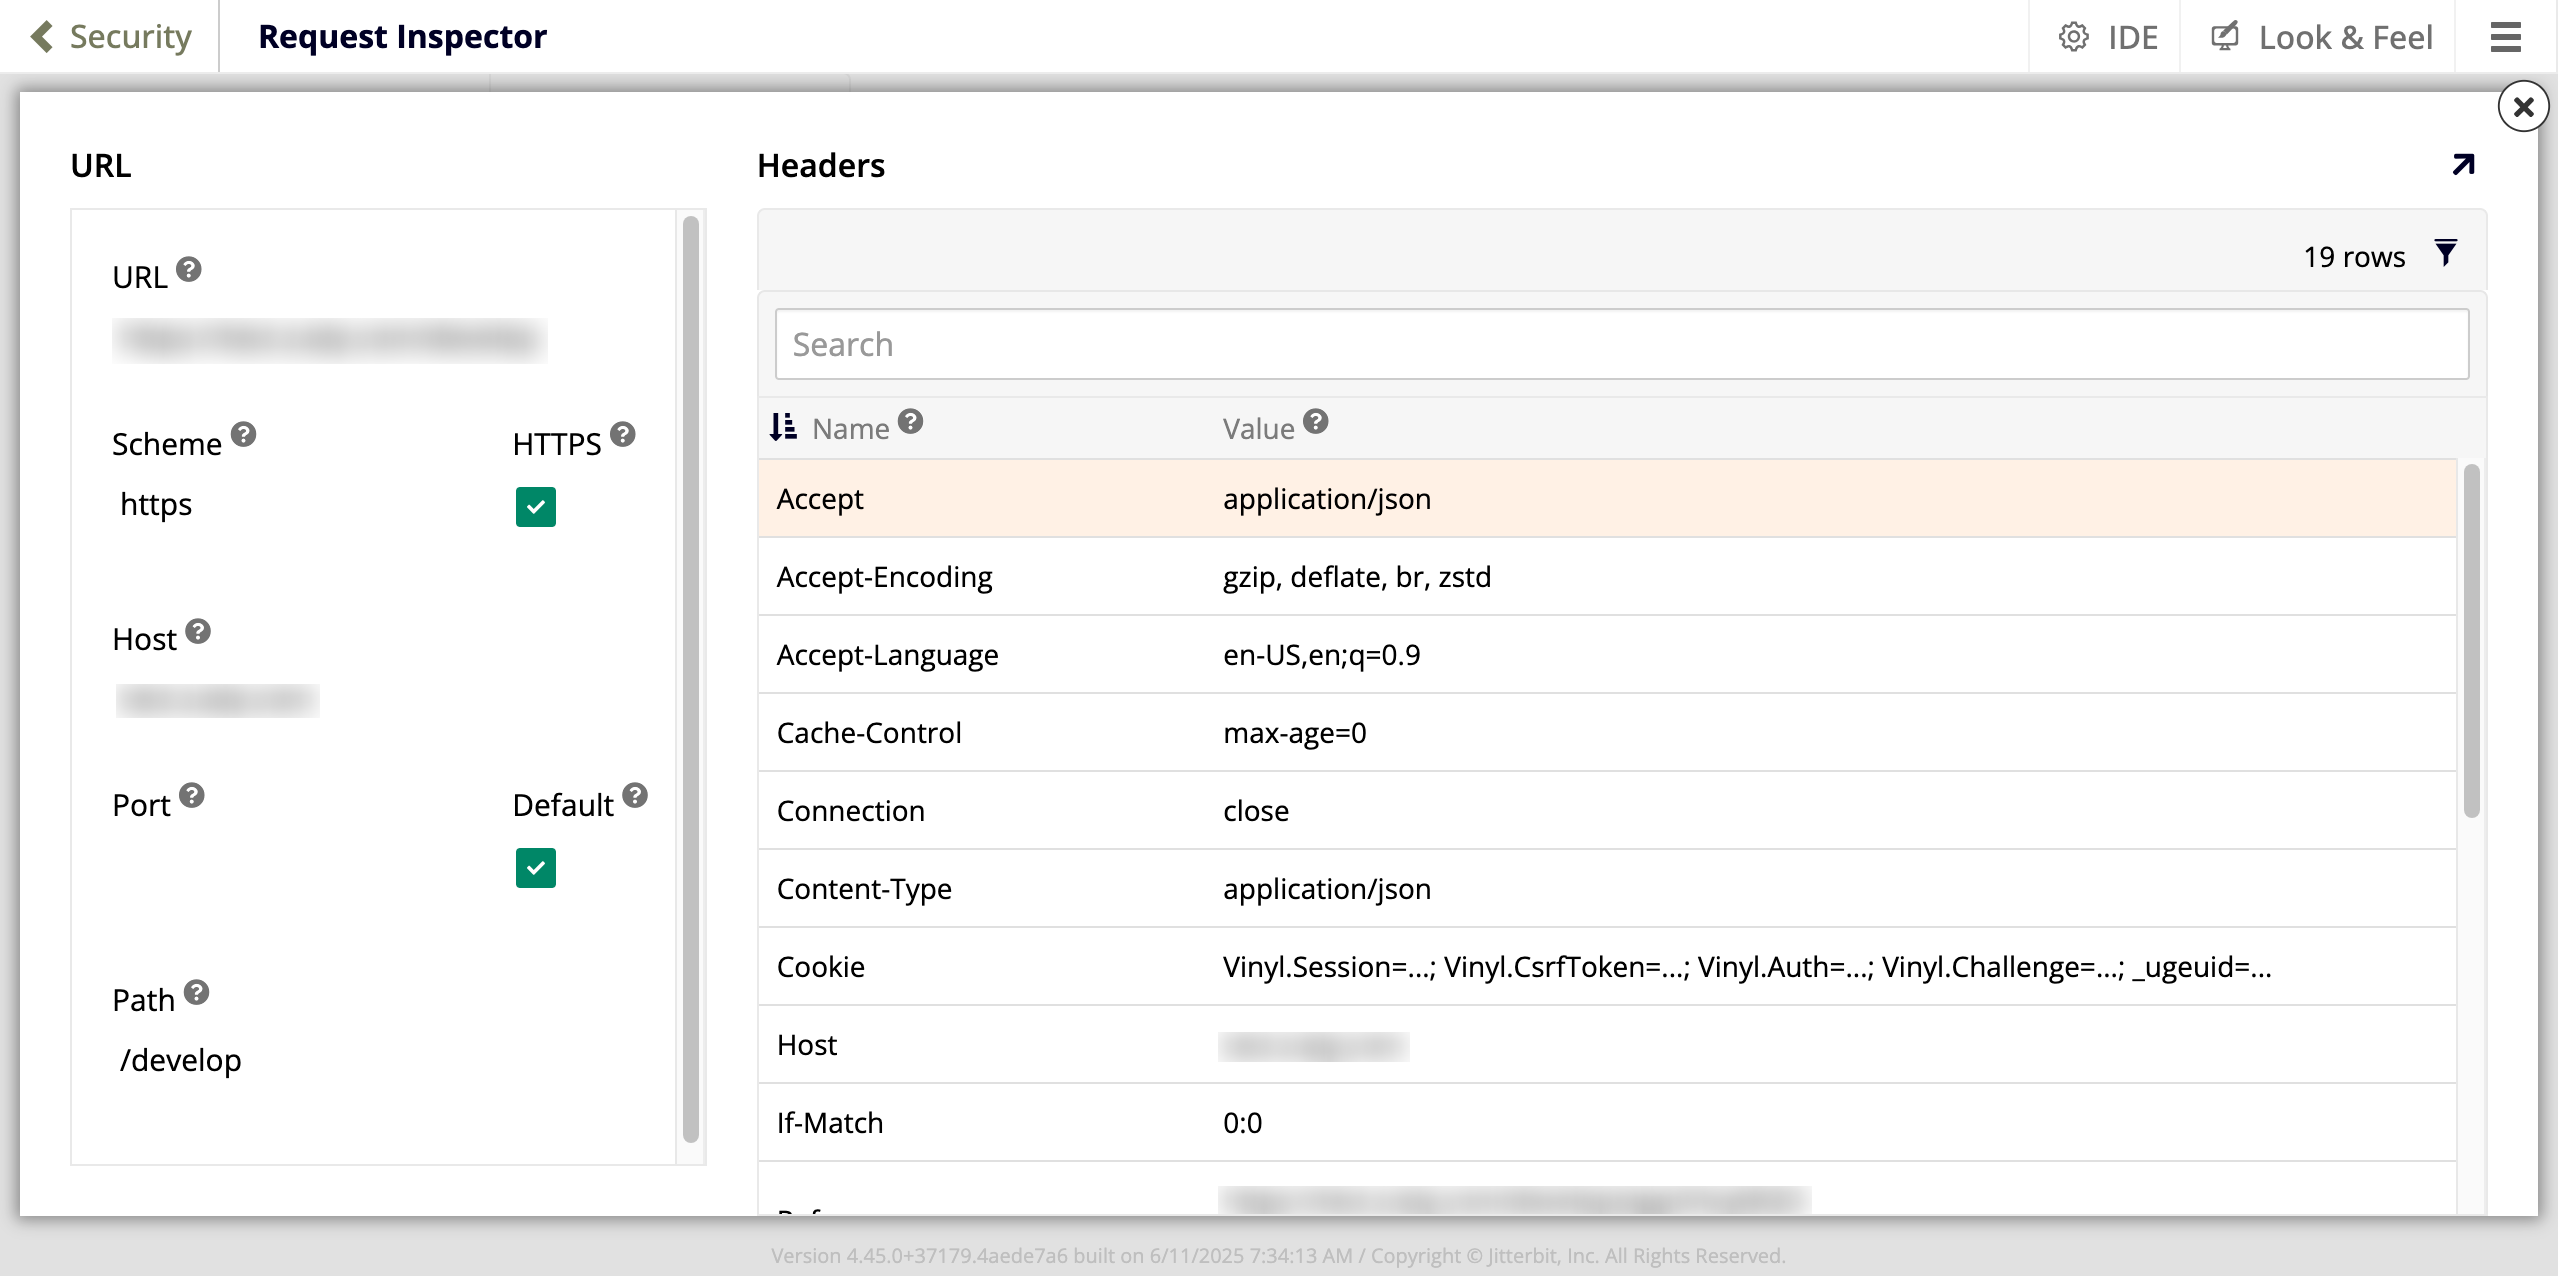
The URL panel shows:
-
URL: The application's root URL.
-
Scheme: The URL scheme, either HTTP or HTTPS.
-
HTTPS: A green check is displayed when the scheme is HTTPS.
-
Host: The host name, typically a DNS name or IP address.
Note
Punycode characters are decoded to Unicode.
-
Port: The port number is shown here, unless a default port (
80for HTTP or443for HTTPS) is used. -
Default: A green check is displayed when a default port is being used.
-
Path: The application's root path.
The Headers panel shows a table containing all the HTTP headers. A search bar allows you to look up a specific header. Each row of the table corresponds to a header, with the Name column showing its name, and the Value column listing the current value of the header.