Dashboard in Wevo iPaaS
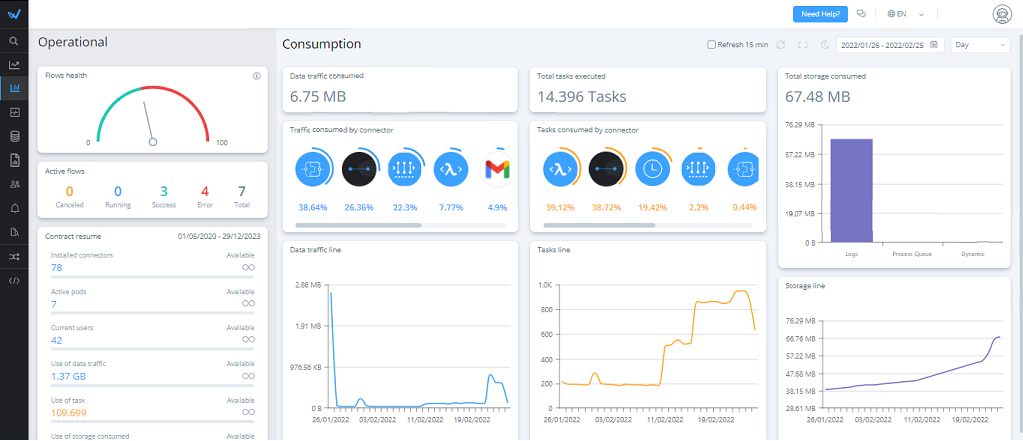
The integration dashboard is an area containing graphs and general information about how your tenant is being used, showing data referring to the consumption and processing of information. It is the first screen that's shown to you when you log into the Wevo platform and this page describes some of its features.
-
Resume: This card shows a general overview of the platform utilization displaying the most important topics, such as the amount of data transited and stored, the number of executions, etc. Under Available, you can see how much is still available to your tenant depending on the details of your contract.
-
Active Pods: Quantity of pods being currently used and how many are available. By default, each active flow uses one pod, but you can increase the amount of pods used by a flow, if that is permitted in your contract.
-
Current Users: Amount of current users and how many are allowed.
-
Connectors: Amount of connectors installed and how many are allowed.
-
Flows Health: An indicator evaluating the overall health of your flows.
-
Constructed Flows: Measures the total number of existing flows, how many are inactive and how many have run successfully or with errors.
-
Traffic Consumed by Connector: Shows the percentage of data traffic consumed by each connector you use.
-
Tasks Consumed by Connector: Shows the percentage of how much was consumed during the execution of the connectors you use.
-
Data Traffic Line: A graph that shows consumption in 4-day intervals. By clicking on the card, a field is shown where you can view tasks by flow, including a search field you can use to look up a specific flow.
-
Tasks Line: Also shows a graph, but this one depicting consumption by flow execution. Like with the previous card, also includes a search field.
-
Total Storage Consumed: Shows the total data consumption by the storages.
-
Storage Line: Another graph that shows the storage consumption timeline.