Consultas SQL de perfil usando logs no Jitterbit App Builder
Introdução
Se você suspeita que um objeto de negócios tem problemas de desempenho, pode obter a instrução SQL dos logs do App Builder e, em seguida, executá-la por meio de uma ferramenta de banco de dados para identificar áreas de melhoria. Esta página explica como fazer isso.
Capturar e analisar consultas lentas
Para capturar e analisar uma consulta lenta, siga estas etapas:
-
No seu aplicativo do App Builder, navegue até a página onde o objeto de negócios lento está sendo executado.
-
Selecione IDE > Monitoramento.
-
No painel Logs, clique no botão Logs de Memória.
-
Clique no botão Editar Configuração. A janela pop-up Configuração do Log do Servidor de Aplicativos aparece.
-
Clique no botão Editar.
-
No painel Configuração do Log de Memória, defina a Severidade Mínima como Rastreamento.
Importante
Sempre redefina este valor de volta para Desligado quando terminar de capturar informações de log para evitar impactar o desempenho.
-
Clique no botão Salvar e, em seguida, feche o diálogo para retornar à página Logs de Memória.
-
Atualize a página do aplicativo que contém o objeto de negócios lento para garantir que a consulta seja capturada no log.
-
Role pelos dados do log para localizar a instrução SQL que você está procurando. Ela começará com
SELECT. Por exemplo: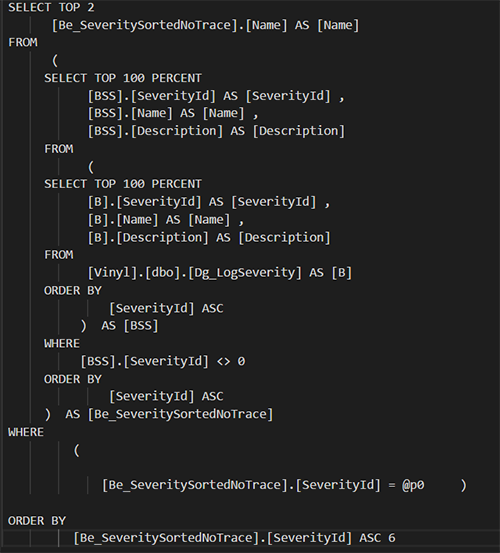
-
Copie toda a instrução SQL.
-
Volte para a configuração do log (Editar Configuração > Editar) e defina a Severidade Mínima para a Configuração do Log de Memória de volta para Desligado.
-
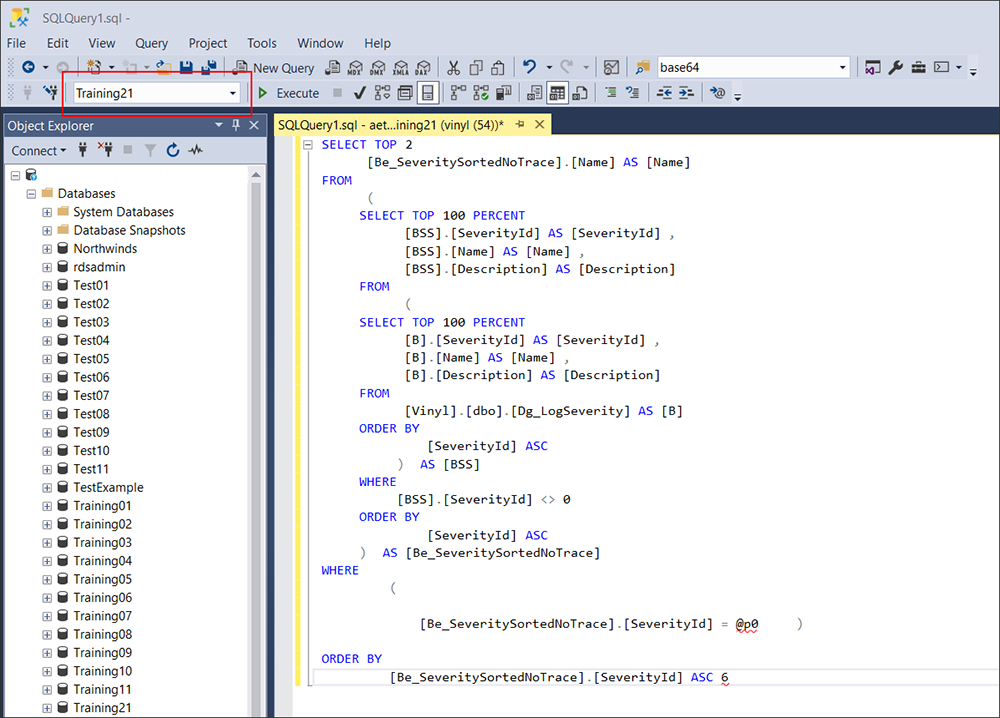
Inicie o SQL Server Management Studio (SSMS).
-
Conecte-se ao seu banco de dados do App Builder.
-
Agora você pode usar o SSMS para analisar a consulta. Por exemplo, você pode colar a consulta em uma janela de Nova Consulta e usar as ferramentas integradas para visualizar seu plano de execução ou enviá-la para o Advisor de Ajuste do Motor de Banco de Dados.
-
Para analisar a consulta, você pode clicar com o botão direito no painel de consulta e selecionar Analisar Consulta no Advisor de Otimização do Banco de Dados. Você também pode selecionar Exibir Plano de Execução Estimado na barra de ferramentas. O plano de execução mapeia o caminho que a consulta percorre e ajuda a identificar partes que podem estar consumindo um tempo significativo.