Depurando consultas do Jitterbit App Builder com ferramentas de desenvolvedor do navegador
Introdução
Os navegadores modernos possuem ferramentas de desenvolvedor (devtools) integradas. Você pode usar essas ferramentas para diagnosticar problemas no App Builder com solicitações que não estão sendo respondidas ou tratadas corretamente, gravar um arquivo HAR que pode ser usado para solução de problemas adicionais e ajudar a identificar questões relacionadas ao tempo de carregamento da página. Você também pode capturar capturas de tela, emular a experiência de um usuário móvel e analisar as solicitações feitas pela página enquanto ela carrega para identificar áreas específicas que impactam o tempo de carregamento da página.
Esta página explica essas opções usando as DevTools do Chrome do Google como exemplo.
Identificar códigos de erro HTTP
Os códigos de status de resposta HTTP indicam se uma solicitação HTTP específica foi concluída com sucesso. Você pode usar as devtools para visualizar e filtrar esses códigos para ajudar a isolar e identificar um erro em uma solicitação do App Builder que não está sendo respondida ou tratada corretamente.
Na aba Rede, filtre os resultados clicando nos cabeçalhos das colunas. Por exemplo, você pode clicar em Status para visualizar os resultados dos códigos HTTP e identificar quaisquer tarefas que não retornem um resultado 200 OK:
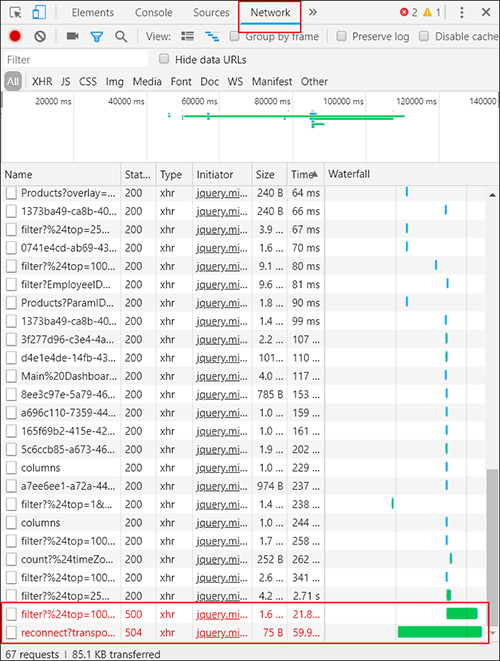
Neste exemplo, a página do aplicativo está gerando mensagens de erro 500 Erro Interno do Servidor e 504 Tempo Limite do Gateway. As informações contidas na coluna Nome deste resultado ajudam a definir onde no App Builder esse erro está sendo iniciado.
Estes são resultados comuns de códigos de erro HTTP no App Builder:
| Código | Descrição | Erro do cliente | Erro do servidor |
|---|---|---|---|
| 301 | Movido permanentemente | ||
| 302 | Encontrado | ||
| 307 | Redirecionamento temporário | ||
| 308 | Redirecionamento permanente | ||
| 400 | Solicitação inválida | ||
| 401 | Não autorizado | ||
| 403 | Proibido | ||
| 404 | Não encontrado | ||
| 405 | Método não permitido | ||
| 500 | Erro Interno do Servidor | ||
| 502 | Gateway ruim | ||
| 503 | Serviço indisponível | ||
| 504 | Tempo Limite do Gateway |
Gerar um arquivo .har
Um arquivo .har (HAR) é um formato de arquivo de arquivo em JSON para registrar a interação de um navegador da web com um site. Você pode compartilhar esses arquivos com o suporte do App Builder para ajudar na solução de problemas.
Para gerar um arquivo HAR, siga estas etapas:
-
Abra seu navegador e vá para a página do App Builder onde você está tendo problemas.
-
Abra as ferramentas de desenvolvedor do seu navegador e selecione a aba Rede.
-
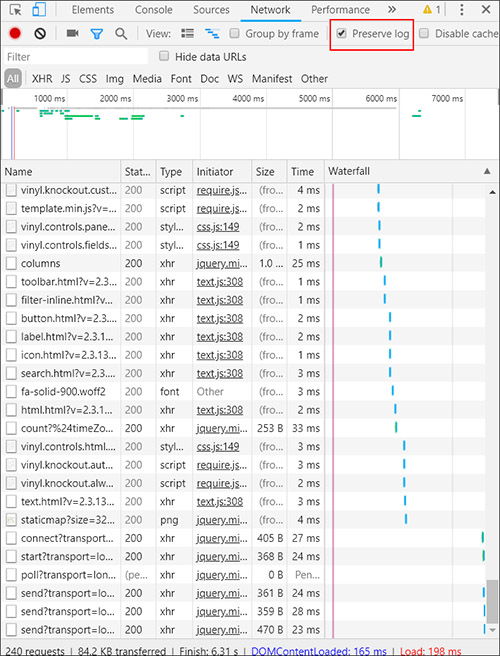
Limpe quaisquer logs existentes e clique no botão de gravação.
-
Tente reproduzir o problema. Enquanto faz isso, todas as solicitações de rede estão sendo registradas:
-
Se você conseguir reproduzir o problema, pare a gravação e procure uma opção para salvar o log como um arquivo HAR.
Identificar problemas de desempenho com solicitações
Você pode usar a aba Rede nas ferramentas de desenvolvedor do seu navegador para encontrar solicitações de longa duração. Para fazer isso, classifique pela coluna Tempo. As colunas correspondentes Nome e Iniciador fornecem informações adicionais sobre a solicitação originada do aplicativo App Builder.
Solicitações nomeadas filter? que estão consumindo a maior parte do tempo de carregamento da página indicam que pode ser necessário otimizar o objeto de negócios correspondente.