Logs (Beta) page in Jitterbit MCP
Introduction
The Logs page displays MCP request executions, along with their related API and operation executions, in an expandable hierarchy. Use this page to trace a request and troubleshoot a failure.
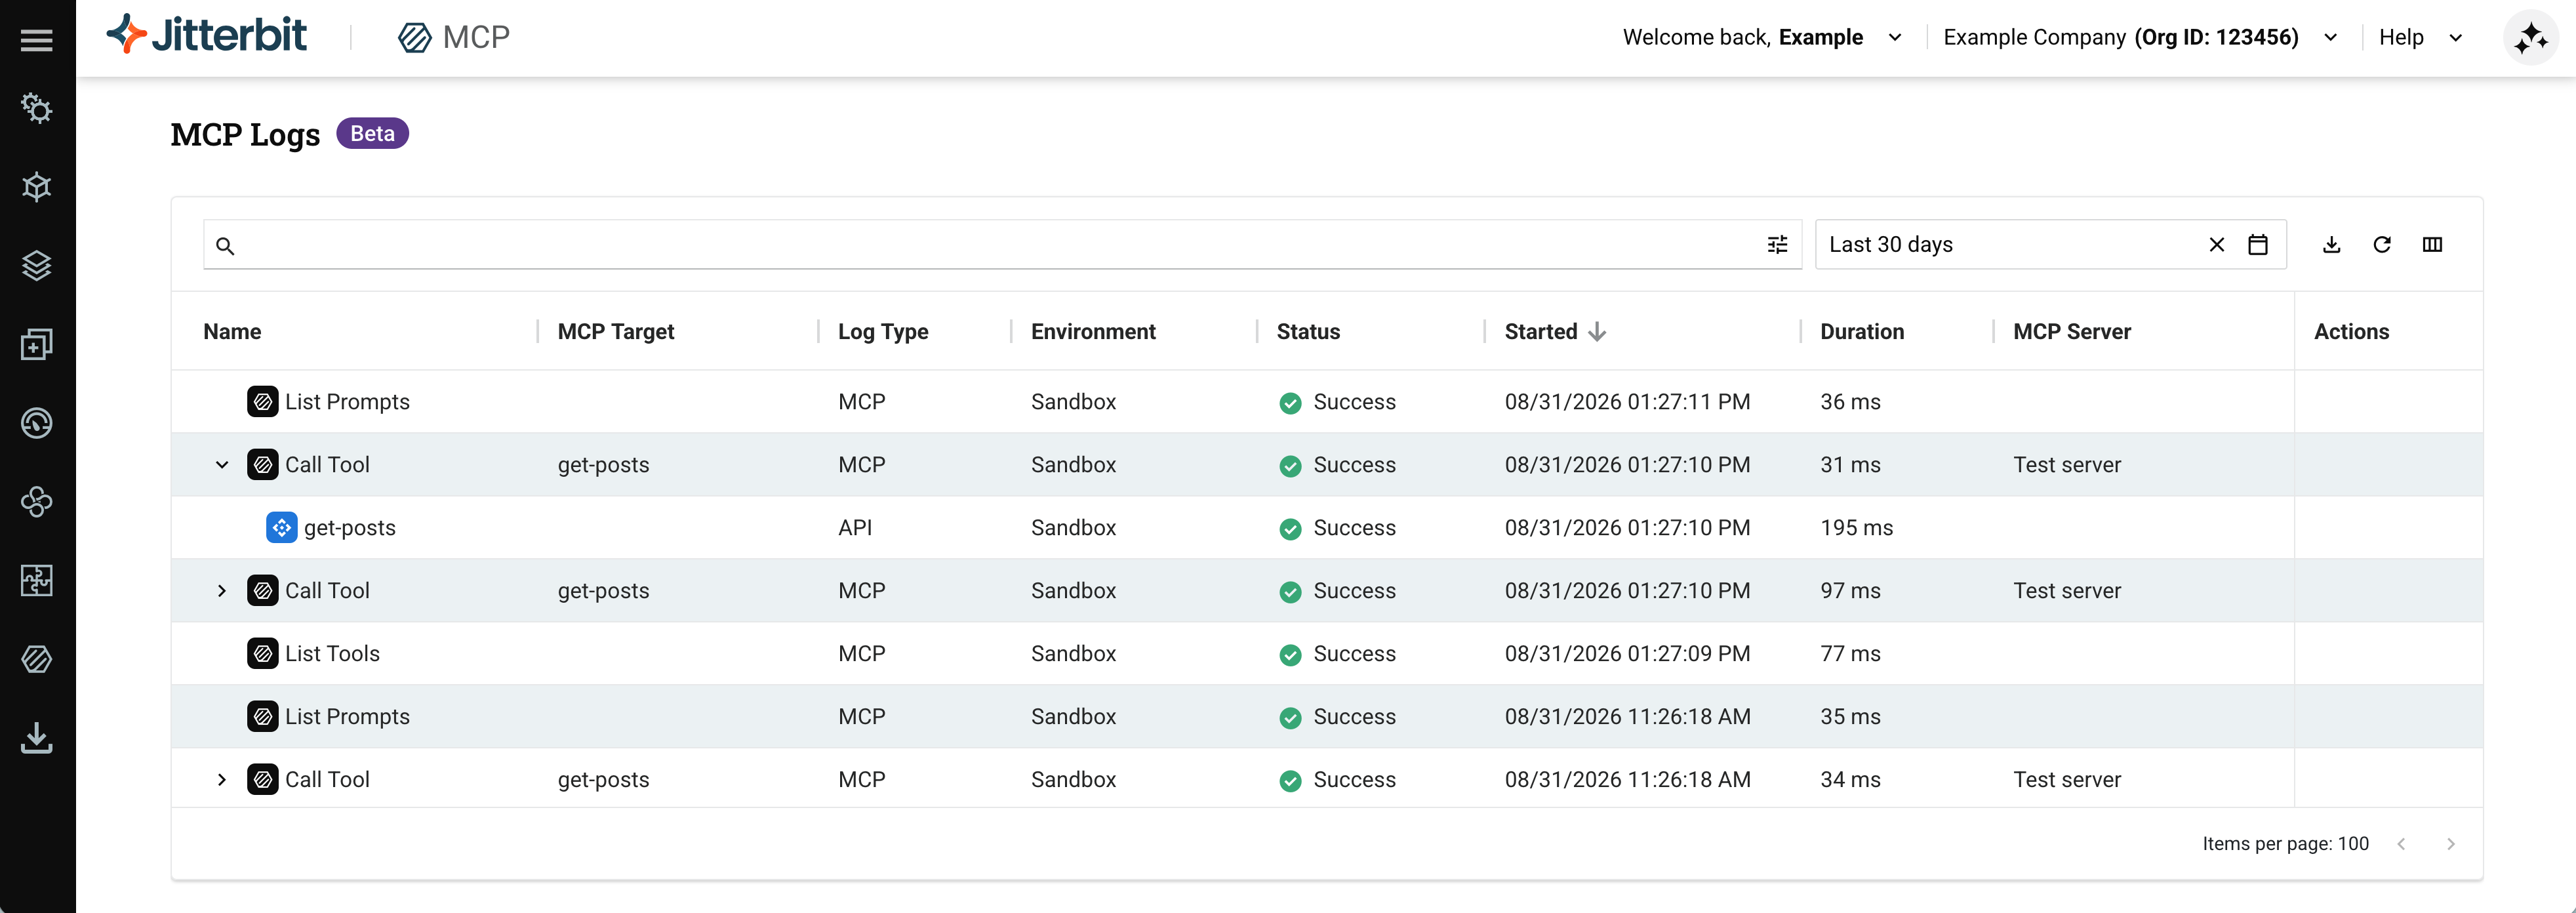
To access the Logs page, use the Harmony portal menu to select MCP > Logs.
Note
Users with the Admin role permission can access this page. MCP log entries are retained for 30 days, matching the retention period for API logs and operation logs.
Logs page controls
The Logs page has controls to filter the data displayed in the log list, set the time range, and manage the table layout.

You can adjust the data displayed by using the search bar, filter panel, date range selector, and toolbar icons.
Search and filter
Enter a query directly into the search bar to search the log list, using the format field=value;, with a semicolon-separated term for each field. As you type, a dropdown appears grouped by field name, letting you select a field's available values instead of typing them.
To build a query without typing the search syntax directly, click . A filter panel opens with the following fields:
-
Name: Filter to executions with a matching name.
-
Environment: Select an environment to filter to.
-
Log Type: Select a log type to filter to, one of MCP, API, or Operation.
-
Status: Select a status to filter to, one of Success, Error, Blocked, Timeout, or Canceled.
-
MCP Server: Select an MCP server to filter to.
-
MCP Target: Filter to executions with a matching MCP target.
-
MCP Gateway: Filter to executions with a matching MCP gateway.
-
MCP Runtime: Filter to executions with a matching MCP runtime.
-
API Name: Filter to executions with a matching API name.
-
Operation Name: Filter to executions with a matching operation name.
When you enter or select values in more than one field, only executions that match every field are returned. Click Search to apply the filter, or Reset to clear all fields.
The panel builds the same query syntax described in this section, and the resulting query appears in the search bar. Filling in a field builds a query in the search bar, using these query keys:
| Field | Query key | Example |
|---|---|---|
| Name | name |
name=Example; |
| Environment | environment |
environment=Sandbox; |
| Log Type | logtype |
logtype=API; |
| Status | status |
status=Success; |
| MCP Server | server |
server=Example server; |
| MCP Target | target |
target=example; |
| MCP Gateway | gateway |
gateway=example; |
| MCP Runtime | runtime |
runtime=example; |
| API Name | api |
api=example; |
| Operation Name | operation |
operation=example; |
For example, setting Name to Example, Environment to Sandbox, Log Type to API, and Status to Success builds the query name=Example;environment=Sandbox;logtype=API;status=Success;. You can also type this query syntax directly into the search bar.
Date range selector
The date range selector displays the currently selected time range (for example, Last 24 hours) and allows you to adjust the log data time frame:

Click the date range selector to open a dialog with two tabs: Relative and Absolute.
Relative tab
The Relative tab provides preset time ranges (Last 1 hour, Last 24 hours, Last 7 days, and Last 30 days), plus a custom relative time period selector at the bottom of the dialog:
-
Number field: Enter the number of time units (for example,
1,7,30). -
Unit dropdown: Select the time unit (for example, Hours).
-
Cancel: Close the dialog without applying changes.
-
Apply: Apply the selected time range and close the dialog.
Absolute tab
The Absolute tab allows you to select a specific start and end date and time.
Click next to the date range selector to reset it.
Additional controls
Additional controls appear on the right side of the toolbar:
-
Download CSV: Downloads the current log list as a CSV file.
-
Refresh: Reloads the log list with the latest data.
-
Columns settings: Click to change the visibility and arrangement of the columns in the log list.
Log list
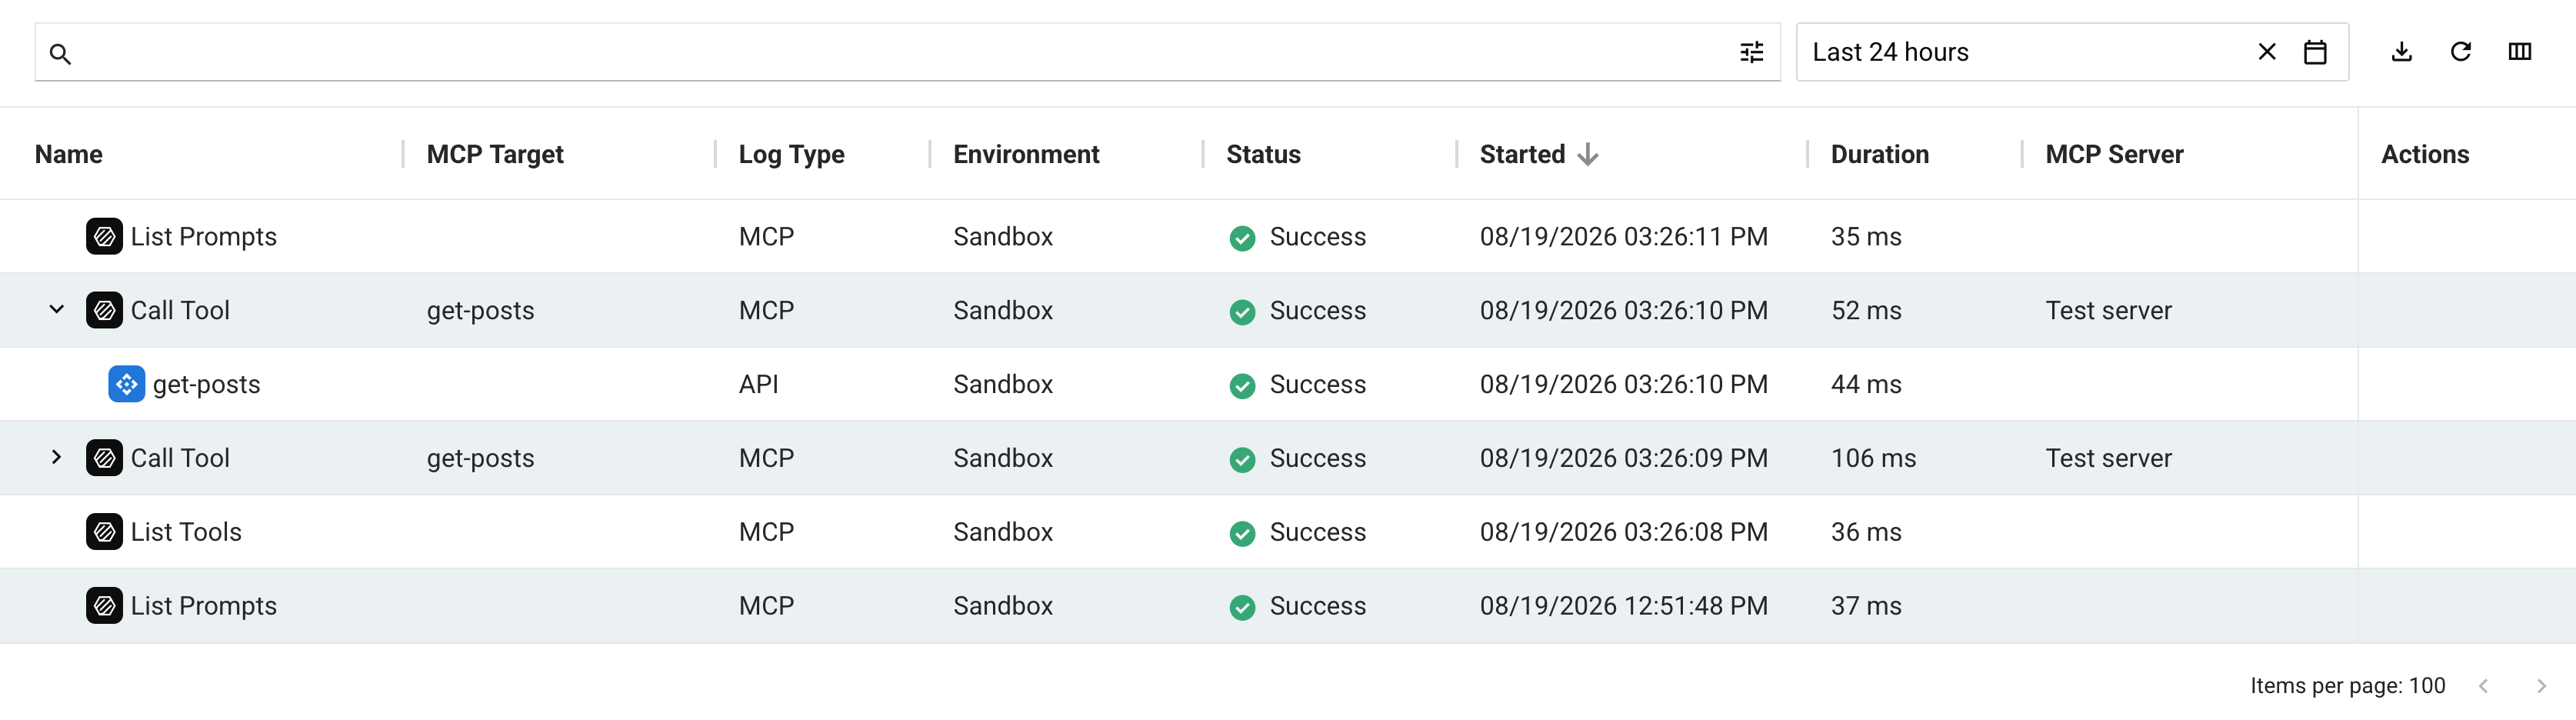
The table displays each execution with these columns by default:
-
Name: The name of the execution, such as
List ToolsorCall Tool. -
MCP Target: The name of the tool or prompt the execution targets, if applicable.
-
Log Type: The execution's type, one of MCP, API, or Operation. An Operation execution can appear nested directly under an MCP execution (when a tool calls the operation directly) or under an API execution (when the operation is called by an API).
-
Environment: The environment the execution ran in.
-
Status: The execution's status, such as Success.
-
Started: The date and time the execution started.
-
Duration: The time elapsed between Started and Finished.
-
MCP Server: The name of the MCP server the execution used, if applicable.
-
MCP Gateway: The MCP gateway that processed the execution.
-
MCP Runtime: The MCP runtime that processed the execution, if applicable.
-
Actions: Hover over an execution row to reveal the View action, which opens the log entry's details.
Click Columns settings to show, hide, or reorder columns. These additional columns are available but not shown by default:
-
Finished: The time the execution's status last changed.
-
API Service URL: The full API service URL for an API execution.
-
Agent: The agent name. Populated for an Operation execution.
-
Project: The name of the project where the underlying operation is running. Populated for an Operation execution.
-
Operation ID: The underlying operation's globally unique identifier (GUID). Populated for an Operation execution.
-
Operation Instance GUID: The globally unique identifier (GUID) of the specific operation instance. Populated for an Operation execution.
-
Root Operation Instance GUID: The globally unique identifier (GUID) of the operation's root (top-level) operation. Populated for an Operation execution; empty for root operations.
Use the carets to expand or collapse an execution's children: an MCP execution can expand to show its related API or Operation execution, and an API execution can expand to show its related Operation execution. Executions with no children, such as List Tools and List Prompts, do not display this icon.
Click a sortable column heading (such as Started) to sort the table in ascending order. Click it again to reverse the sort order.
Click a log row, or hover over the row and click the View action, to open the log entry's details in the panel at the bottom of the page.
Log entry details
The details panel displays the selected entry's name, status, start time, finish time, and duration. The tabs and fields shown depend on whether the selected entry is an MCP execution, a related API execution, or a related Operation execution.
An Operation execution's details mirror the log entry details on the Management Console Runtime page.
MCP execution details
For an MCP execution, the details panel includes Messages and Diagnostics details tabs.
Messages tab
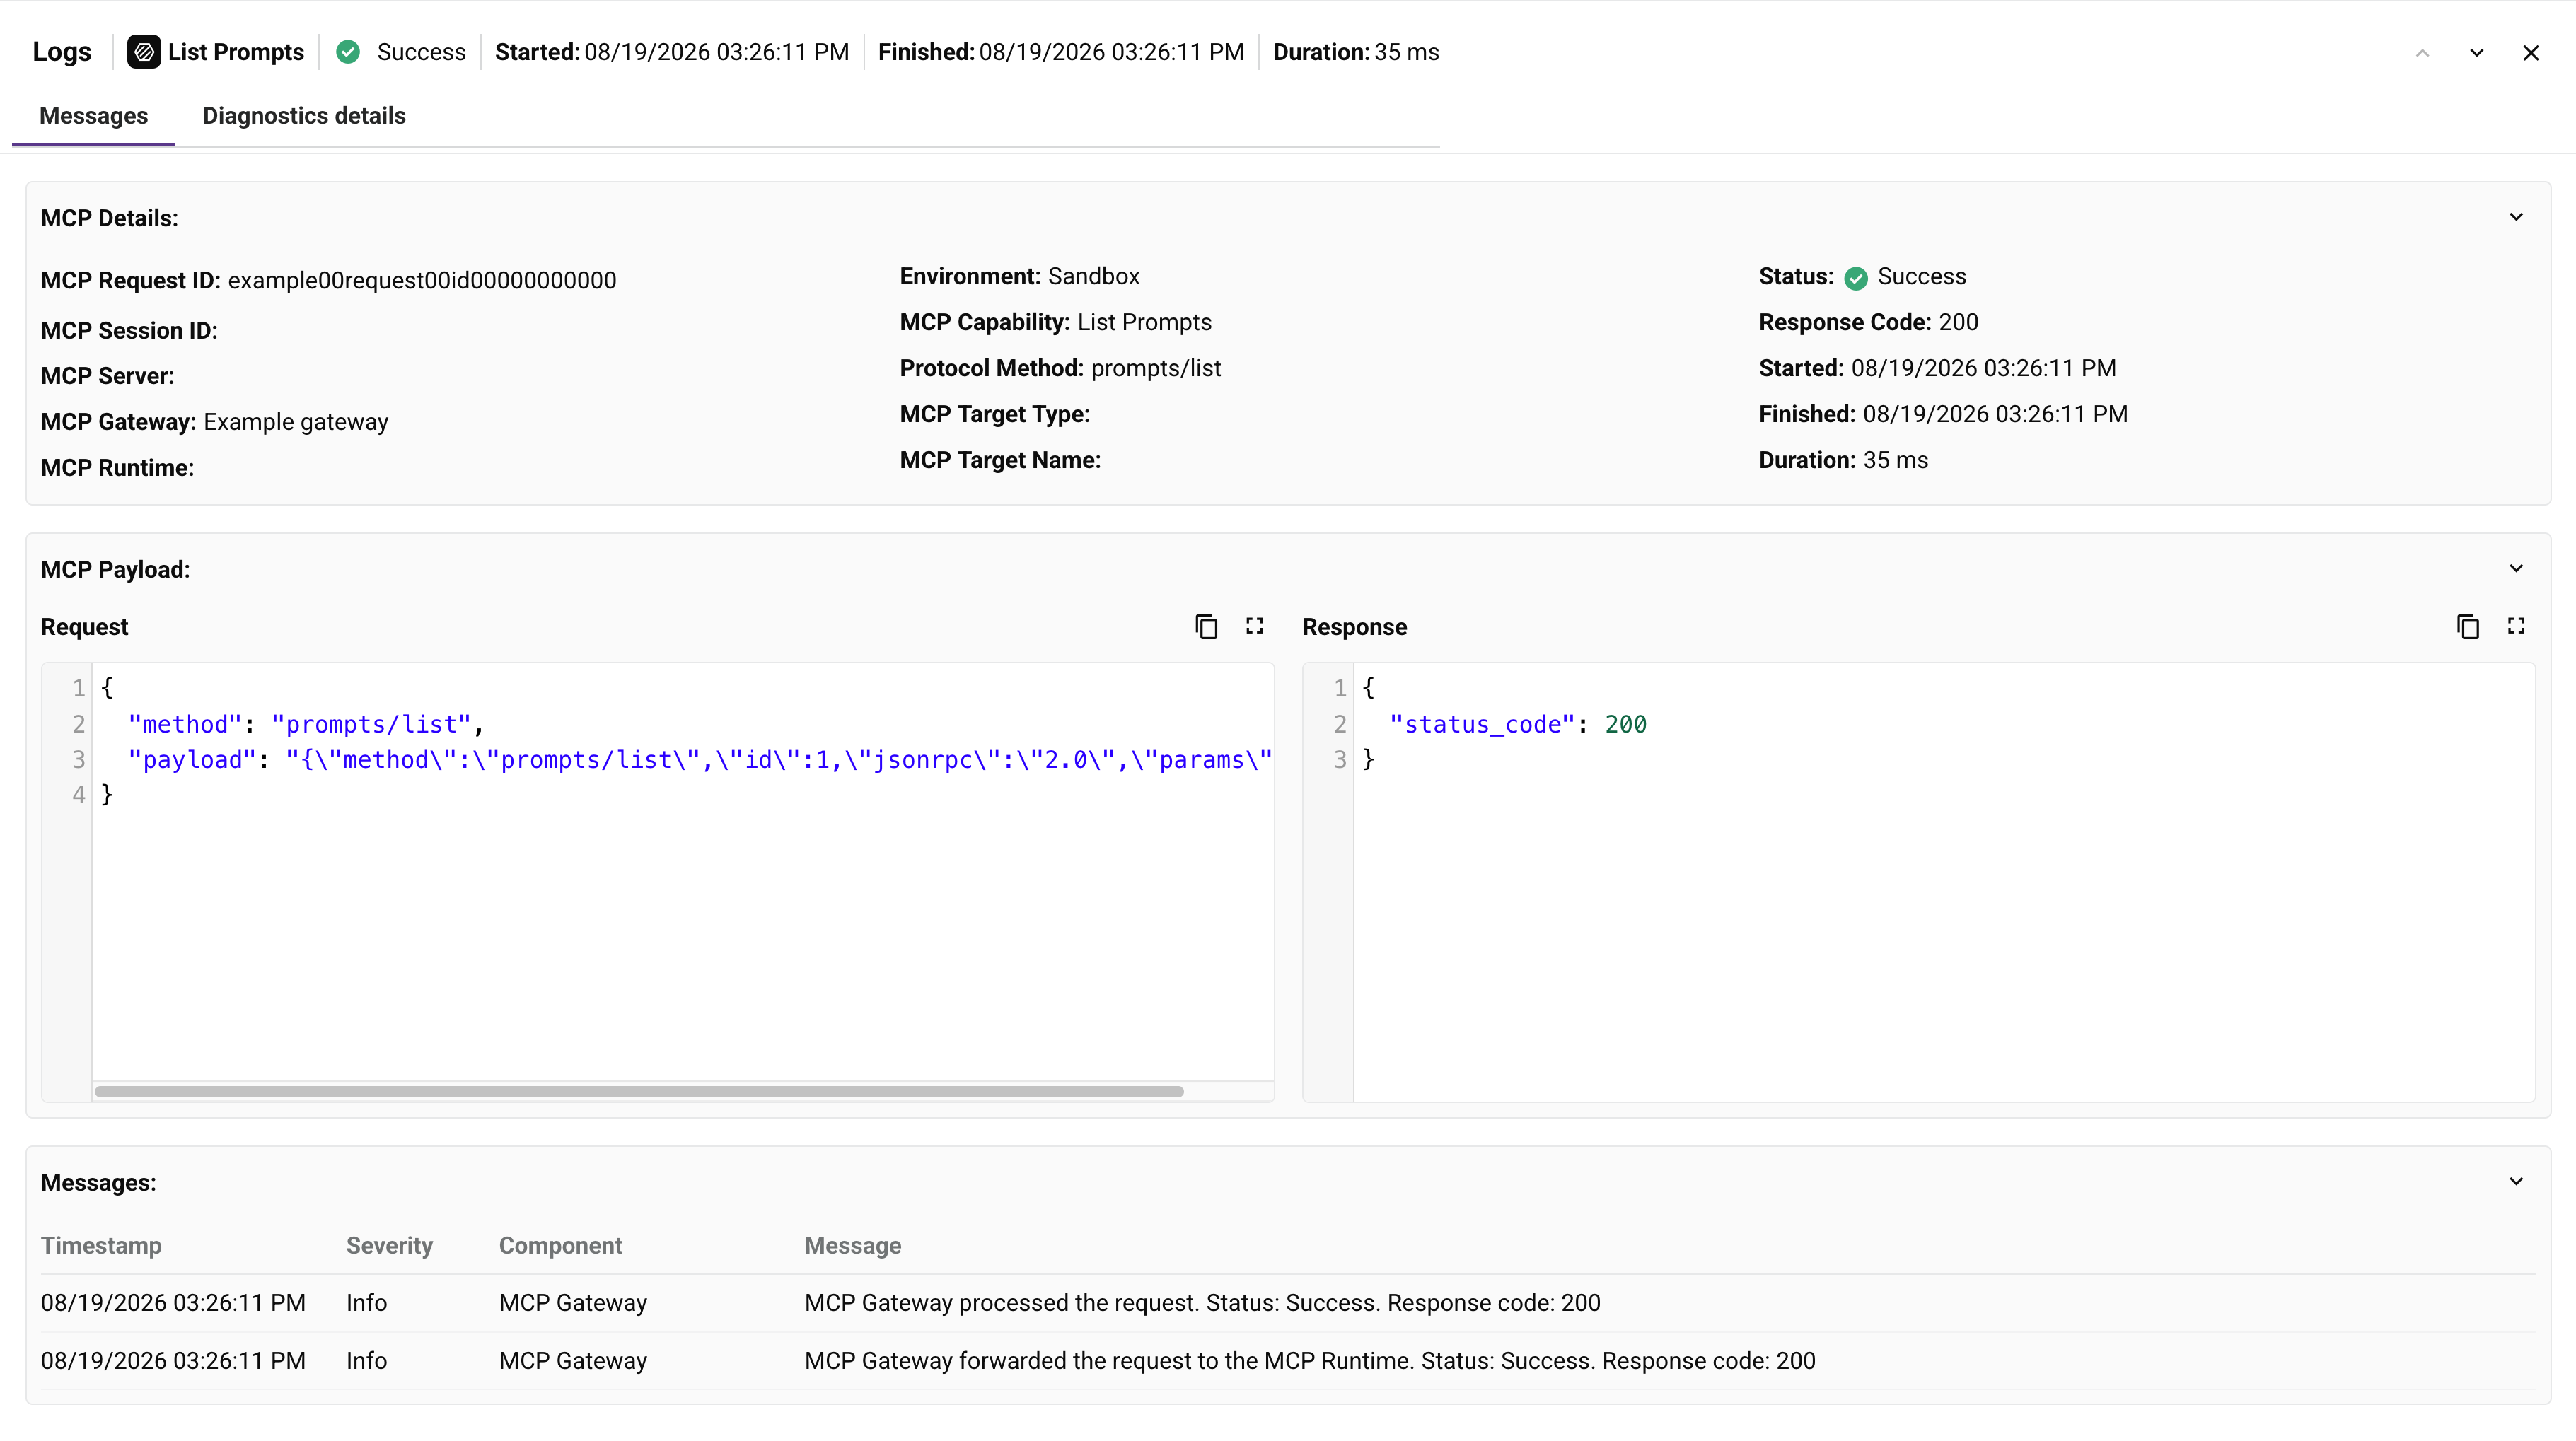
The Messages tab contains three collapsible sections: MCP Details, MCP Payload, and Messages. Click a section heading to expand or collapse it.
MCP Details
The MCP Details section displays the execution's identifying and routing information:
-
MCP Request ID: The execution's unique identifier.
-
MCP Session ID: The MCP client session's unique identifier.
-
MCP Server: The name of the MCP server the execution used, if applicable.
-
MCP Gateway: The MCP gateway that processed the execution.
-
MCP Runtime: The MCP runtime that processed the execution, if applicable.
-
Environment: The environment the execution ran in.
-
MCP Capability: The capability action invoked, matching the execution's Name (for example,
List Prompts). -
Protocol Method: The underlying MCP protocol method used for the execution (for example,
prompts/list). -
MCP Target Type: The type of the invoked target, if applicable.
-
MCP Target Name: The name of the tool or prompt the execution targets, if applicable.
-
Status: The execution's status.
-
Response Code: The execution's HTTP response code.
-
Started: The date and time the execution started.
-
Finished: The time the execution's status last changed.
-
Duration: The time elapsed between Started and Finished.
Note
Some fields, such as MCP Session ID, MCP Server, MCP Runtime, MCP Target Type, and MCP Target Name, are not populated for every execution. For example, a List Prompts execution has no specific target, so its MCP Target Type and MCP Target Name fields are empty.
MCP Payload
The MCP Payload section displays the execution's Request and Response payloads, side by side. Click the copy icon to copy a payload, or the expand icon to view it full screen (click to return to the default view).
Messages
The Messages section displays a table of the execution's processing steps, with the following columns:
-
Timestamp: The date and time of the processing step.
-
Severity: The severity level of the message.
-
Component: The MCP component that logged the message, such as the MCP gateway or MCP runtime.
-
Message: A description of the processing step. For example, a message might show that the MCP gateway processed a request and then forwarded it to the MCP runtime.
Diagnostics details tab
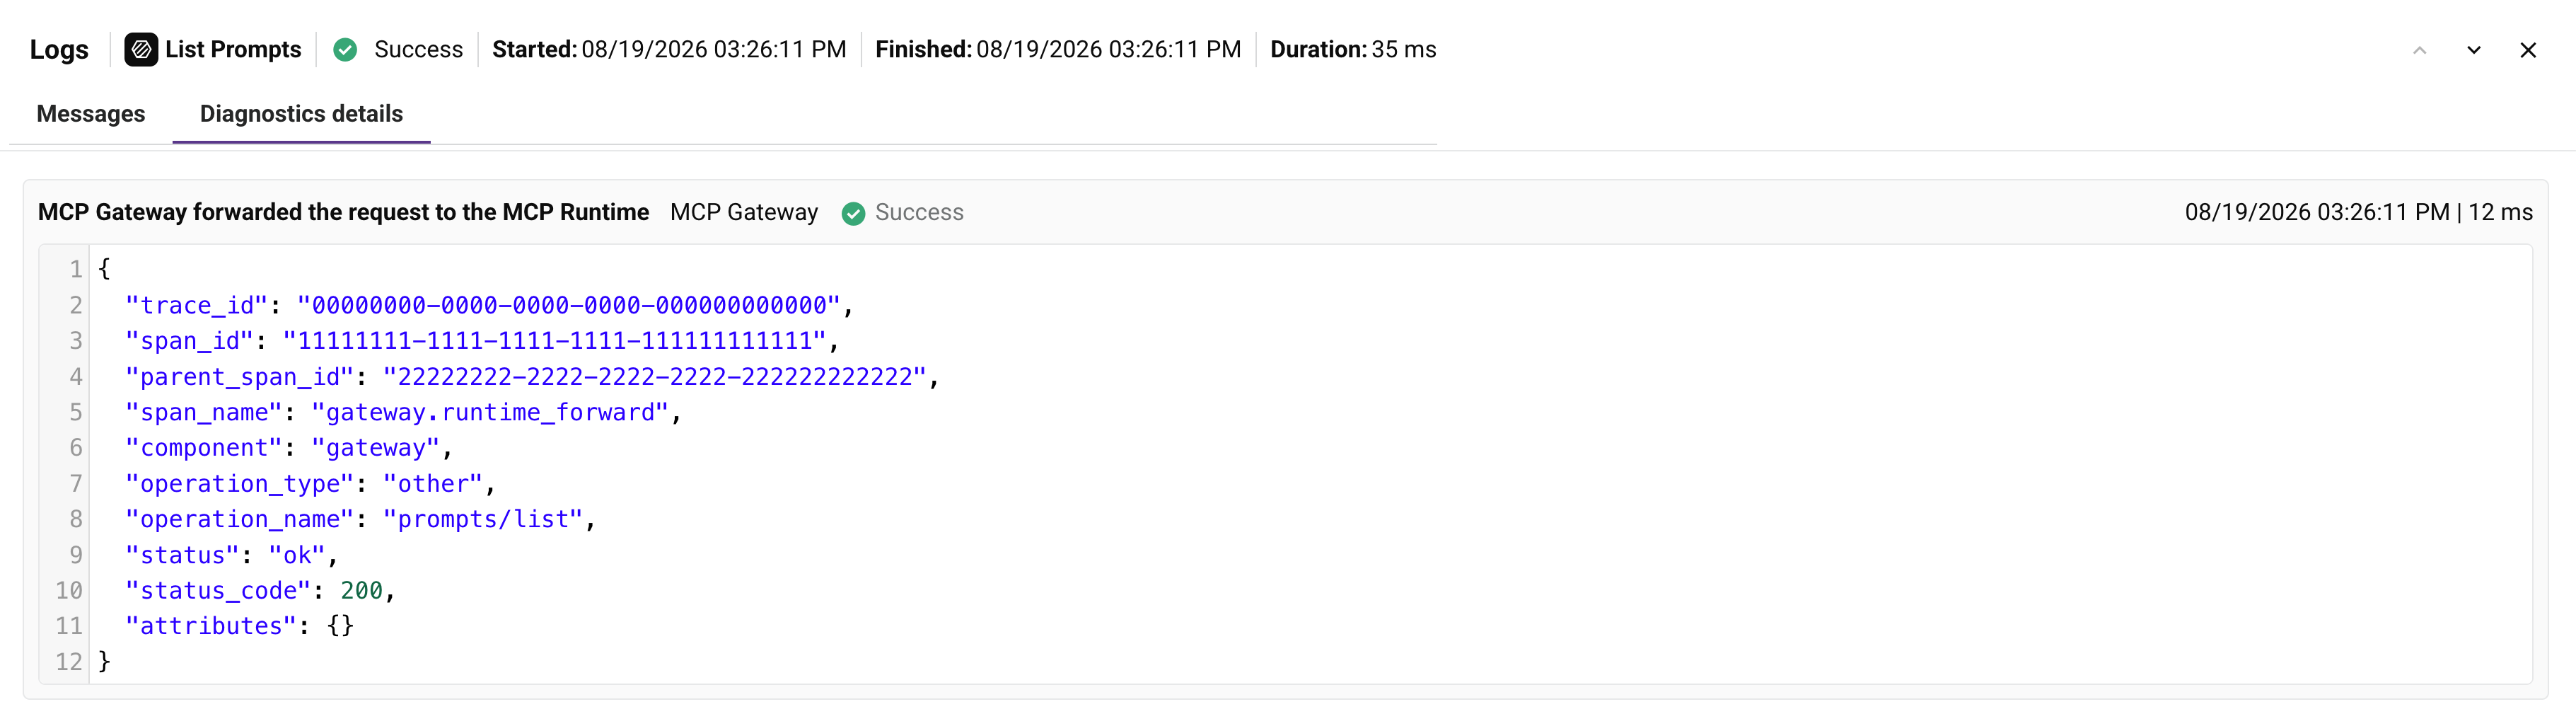
The Diagnostics details tab lists an expandable entry for each processing step shown on the Messages tab. Each entry's header displays the step's message, component, status, timestamp, and duration. Expanding an entry shows its trace data as JSON, including the trace ID, span ID, parent span ID, span name, component, operation type, operation name, status, status code, and attributes.
API execution details
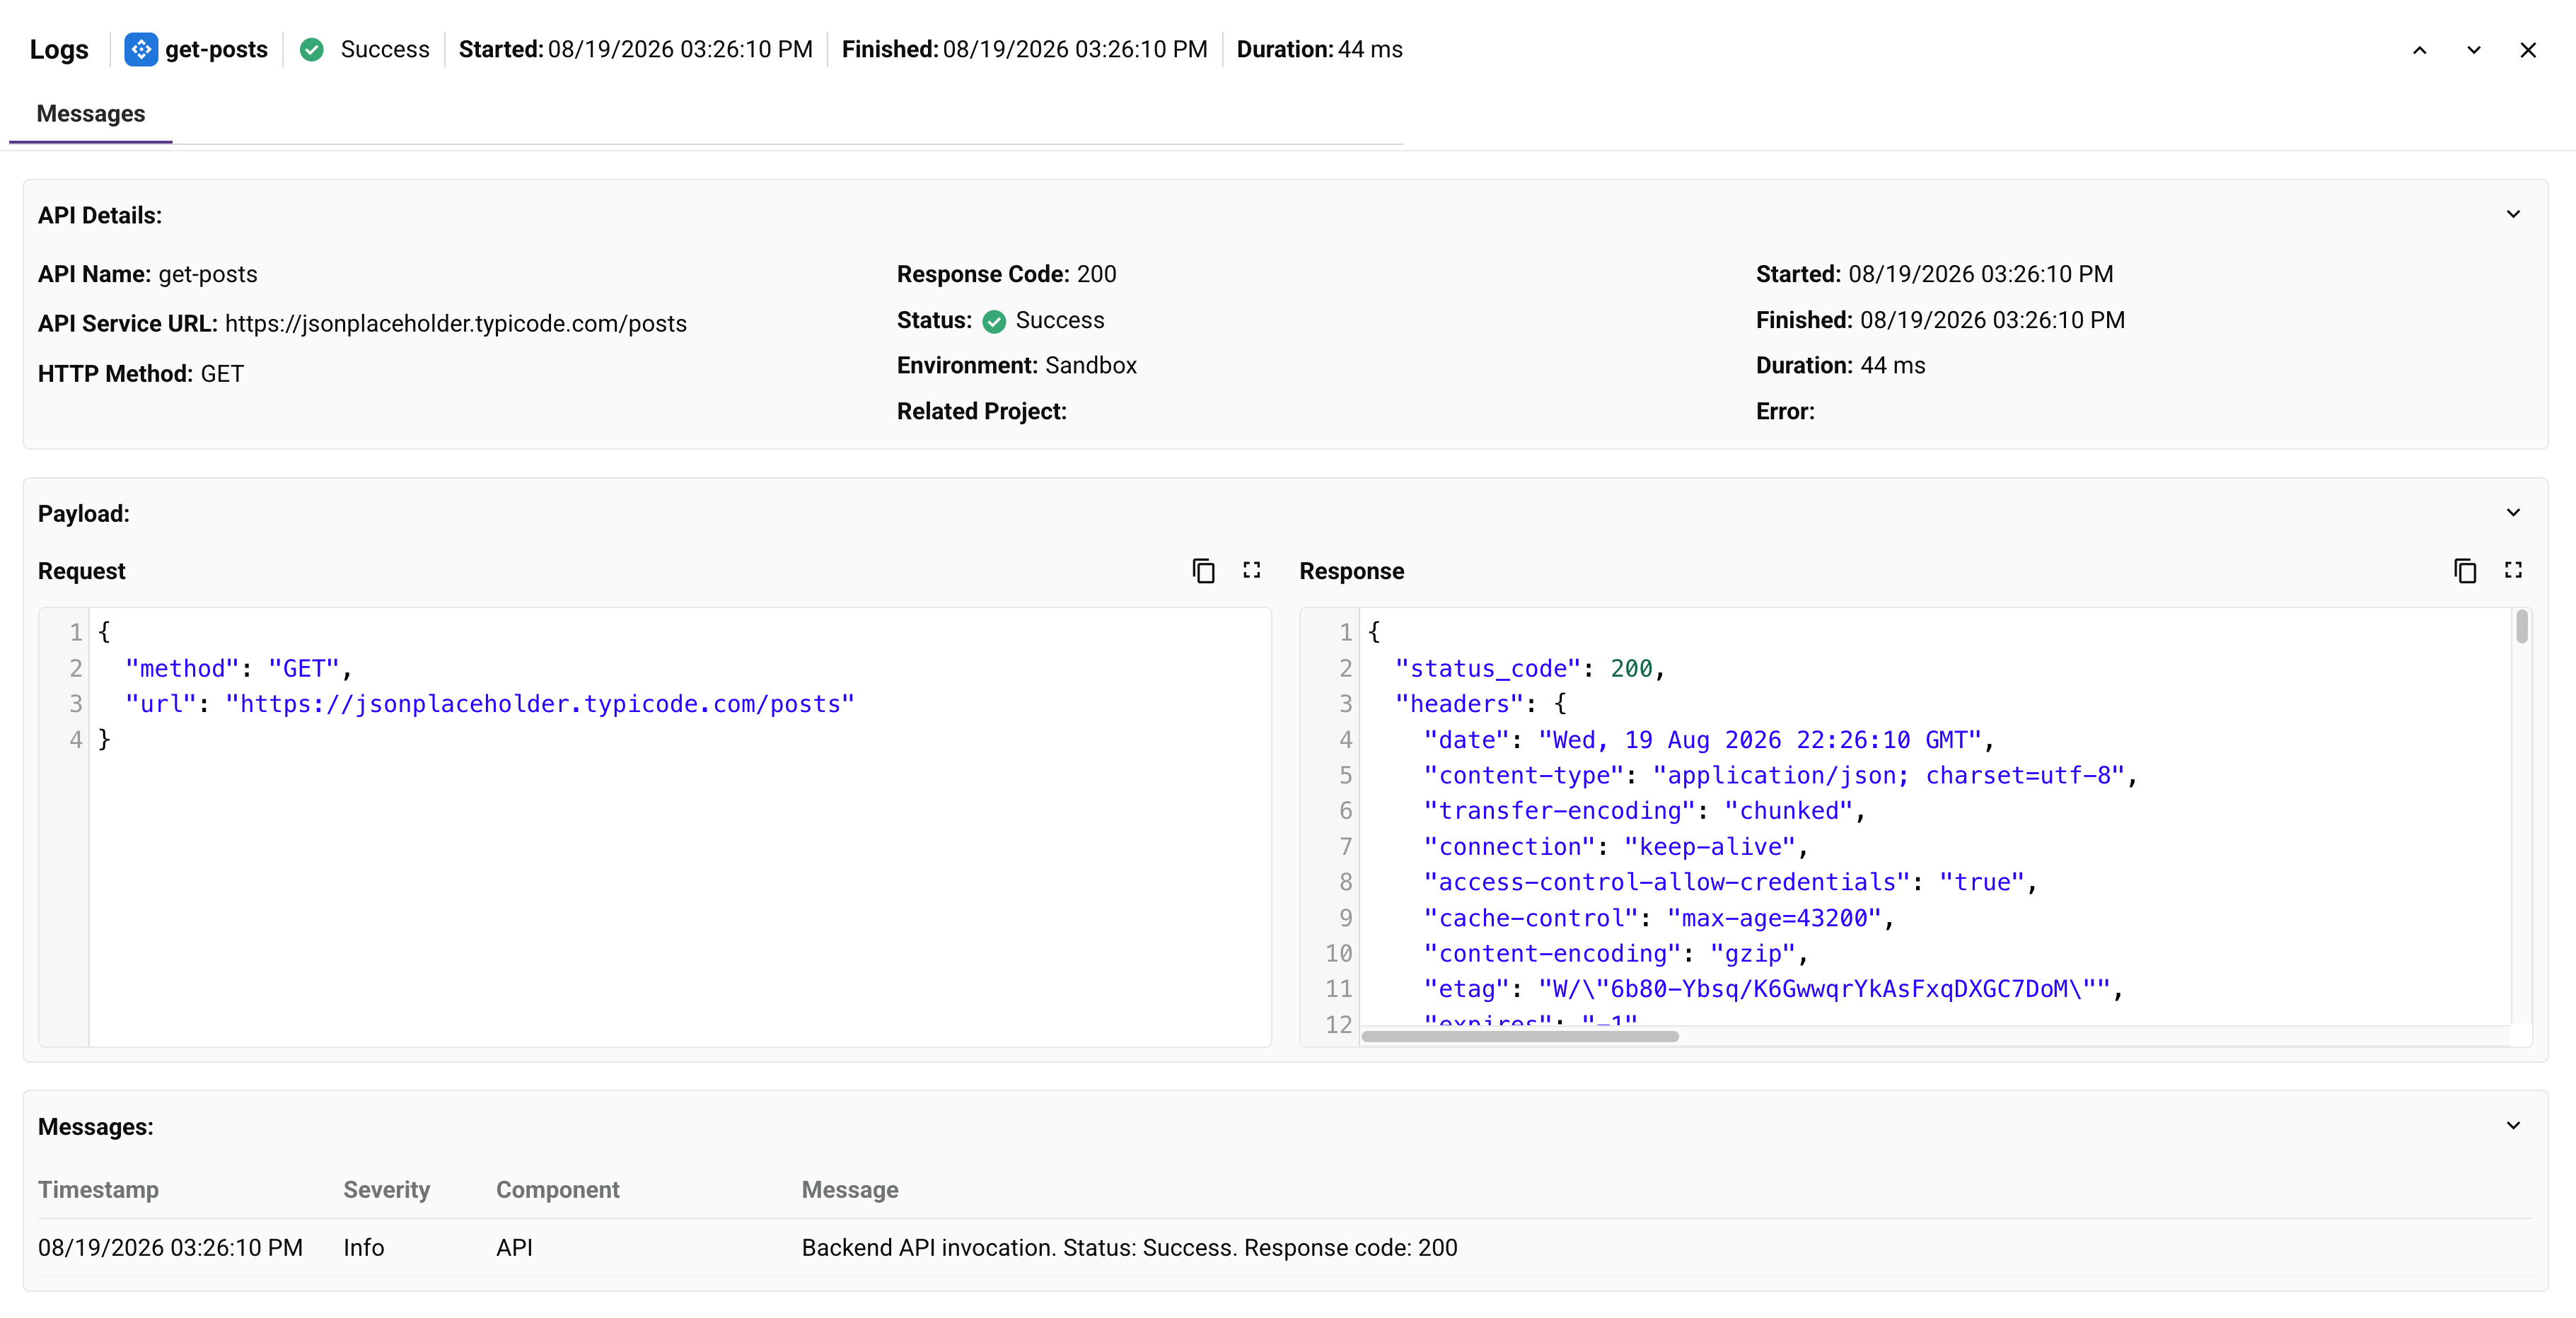
For a related API execution, the details panel includes a Messages tab with the following collapsible sections: API Details, Payload, and Messages. The Payload and Messages sections are the same as described above for an MCP execution's MCP Payload and Messages sections.
API Details
The API Details section displays the execution's identifying information:
-
API Name: The name of the API.
-
API Service URL: The full API service URL for the execution.
-
HTTP Method: The HTTP method used for the API call.
-
Response Code: The execution's HTTP response code.
-
Status: The execution's status.
-
Environment: The environment the execution ran in.
-
Related Project: The name of the project where the underlying operation is running, if applicable.
-
Started: The date and time the execution started.
-
Finished: The time the execution's status last changed.
-
Duration: The time elapsed between Started and Finished.
-
Error: The error message, if the execution failed.