Analytics (Beta) page in Jitterbit MCP
Introduction
The Analytics page displays usage and performance metrics for MCP servers and tools, including request volume, request outcomes, and activity by server and tool.
To access the Analytics page, use the Harmony portal menu to select MCP > Analytics.
Note
Users with the Admin or Read role permission can access this page.
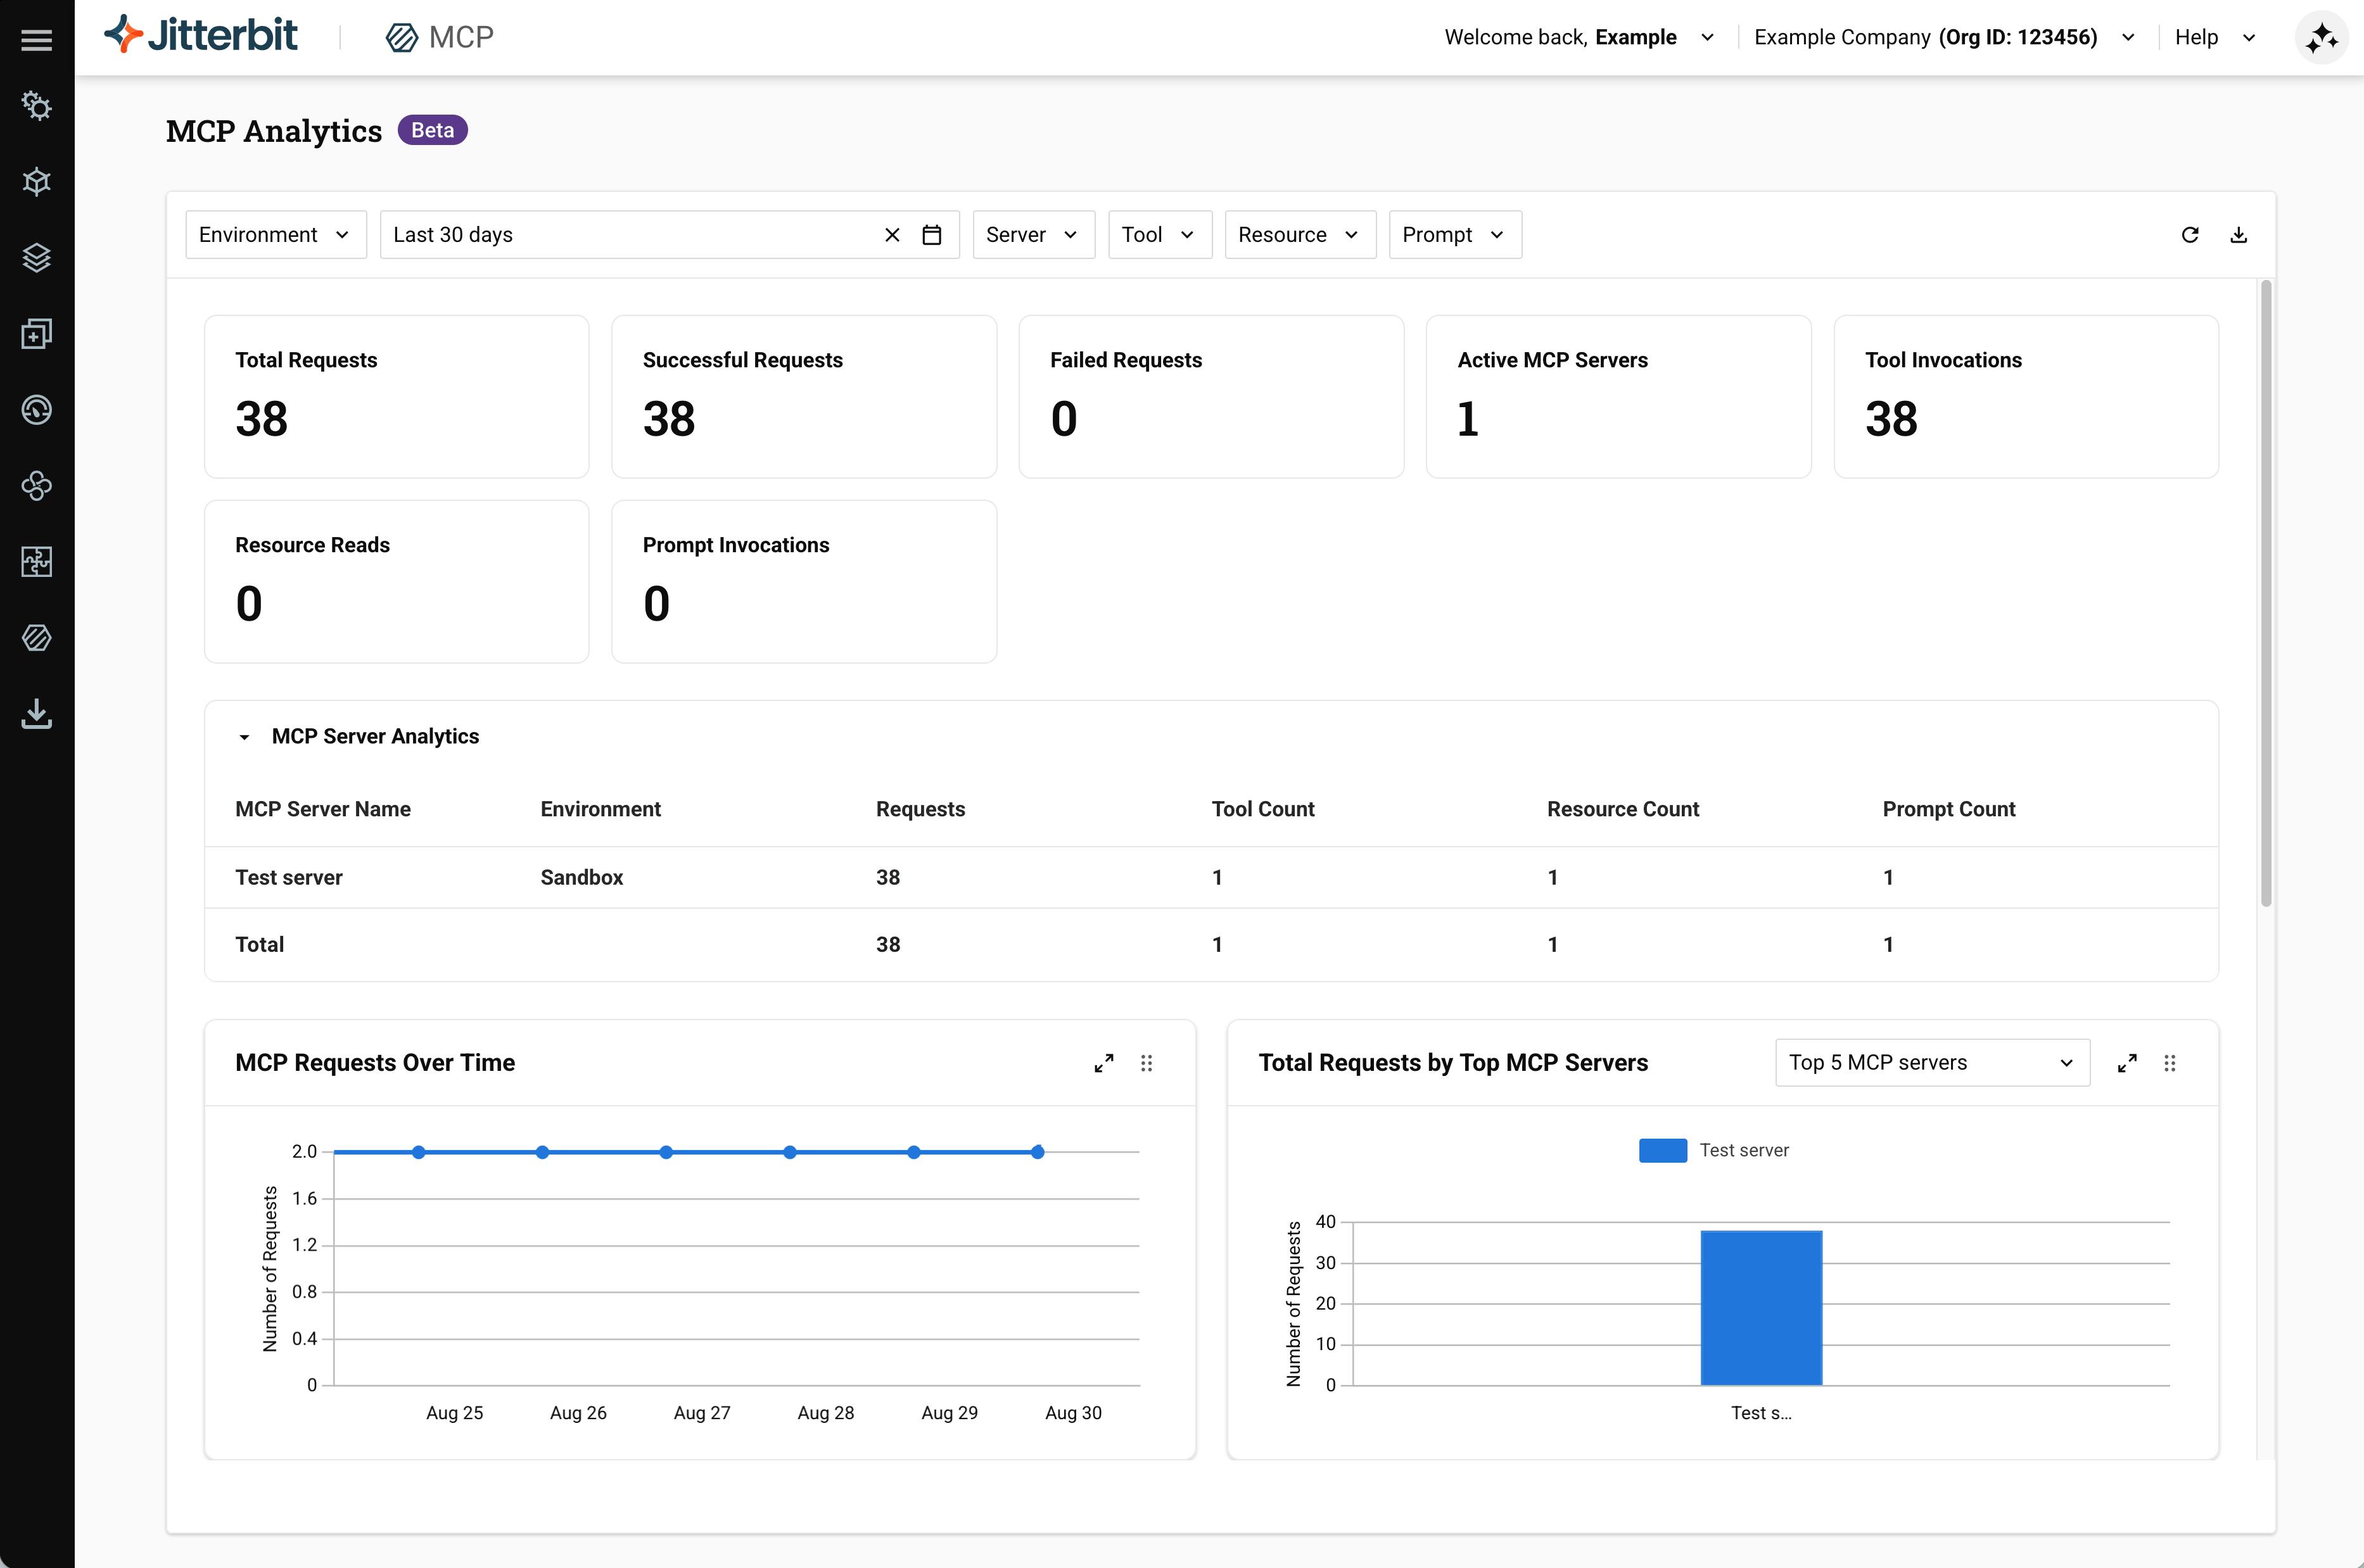
Filters
Use the controls along the top of the page to filter the metrics displayed. The Environment, Server, Tool, Resource, and Prompt filters are dependent: selecting an environment or server narrows the options in the filters that follow it. For each of these five filters, click the checkbox next to a value's name within the dropdown to add or remove it from the selection. When one or more values are selected, a count badge appears next to the filter. To clear all selections for a filter, click the clear icon next to its count badge.
-
Environment: Filter the metrics to one or more environments.
-
Date range: Select the time period to report on. The default is Last 30 days. Preset ranges (such as Last 10 minutes and Last 1 hour) are available, and you can use the calendar icon to set a custom range. Click the clear icon to reset the range.
-
Server: Filter the metrics to one or more MCP servers. When an environment is selected, this list is limited to the servers in that environment.
-
Tool: Filter the metrics to one or more tools. When a server is selected, this list is limited to the tools on that server.
-
Resource: Filter the metrics to one or more resources. When a server is selected, this list is limited to the resources on that server.
-
Prompt: Filter the metrics to one or more prompts. When a server is selected, this list is limited to the prompts on that server.
-
Clear filters: Removes all applied filter selections across the Environment, Server, Tool, Resource, and Prompt filters.
-
Refresh: Reloads the metrics with the latest data.
-
Download CSV: Downloads the current analytics data, based on the applied filters and search criteria, as a CSV file.
Summary metrics
A row of summary tiles displays aggregate metrics for the selected filters and date range:
-
Total Requests: The total number of MCP requests.
-
Successful Requests: The number of MCP requests that completed successfully.
-
Failed Requests: The number of MCP requests that ended in failure.
-
Active MCP Servers: The number of MCP servers that received at least one request during the selected date range.
-
Tool Invocations: The total number of tool invocation requests.
-
Resource Reads: The total number of resource read requests.
-
Prompt Invocations: The total number of prompt invocation requests.
MCP Server Analytics
The MCP Server Analytics section displays a table of per-server metrics for the selected filters and date range. Click the section heading to expand or collapse the table.
The table displays each MCP server with the following columns:
-
MCP Server Name: The name of the MCP server.
-
Environment: The environment the server resides in.
-
Requests: The total number of requests to the server.
-
Tool Count: The number of tools configured on the server.
-
Resource Count: The number of resources configured on the server.
-
Prompt Count: The number of prompts configured on the server.
A Total row at the bottom of the table sums each column across all listed servers.
Charts
The Analytics page displays the following charts. Each chart has an Expand icon to view it full screen, and you can rearrange the charts by dragging them using the handle in the chart's top-right corner. Hover over a data point to display a tooltip with the relevant value, and for a data point representing a specific MCP server, the server's name and environment. For time-based charts, the tooltip also displays the applicable date.
MCP Requests Over Time
A line chart showing MCP request volume over the selected date range.
Total Requests by Top MCP Servers
A bar chart showing the total number of requests by MCP server. Use the dropdown to display the top MCP servers by request count (for example, Top 5 MCP servers).
Top Tools by Invocations
A bar chart showing the number of calls per tool. Use the dropdown to display the top tools by invocation count (for example, Top 5 tools).
Top Resources by Reads
A bar chart showing the number of read requests per resource. Use the dropdown to display the top resources by read count (for example, Top 5 resources).
Top Prompts by Usage
A bar chart showing the number of invocations per prompt. Use the dropdown to display the top prompts by invocation count (for example, Top 5 prompts).
Error Analytics
A stacked bar chart showing MCP requests grouped by HTTP response status code category:
-
Status codes 200-299: Successful requests.
-
Status codes 400-599: Failed requests.
Note
Status codes 300-399 (redirects) are excluded from the Error Analytics chart.