Jitterbit Monitoring App
Overview
Jitterbit provides the Monitoring app through Jitterbit Marketplace. Built with Jitterbit App Builder, it lets an administrator monitor scheduled jobs in an App Builder instance, send email notifications to user groups when a job fails, and record how each failure was resolved. It also includes tools for database maintenance and troubleshooting, and tracks App Server CPU and memory use over time.
You download the app as an App Builder release package (an .LP file) from Marketplace and install it into your own App Builder instance, where you configure which schedules to monitor and who to notify.
This page describes how the app works, its core features, the prerequisites, how to download and install it, how to configure it for your environment, how to use the app, and common troubleshooting steps.
How it works
The app monitors the schedules you select. When a monitored job fails, it notifies the assigned user group and lists the failure on the home dashboard for an administrator to resolve:
in App Builder"] --> B{"Job failed?"} B -->|Yes| C["Monitoring detects
the failure"] C --> D["Email the assigned
user group"] C --> E["Failure listed on
the home dashboard"] E --> F["Administrator reviews
in Job Details"] F --> G["Mark resolved
(kept with notes)"] F --> H["Ignore
(deleted permanently)"]
Core features
-
Failed-job notifications: Monitors the schedules you select and emails the assigned user group when a job fails.
-
Resolution tracking: Mark a failed job as resolved with notes for later reference, or ignore it. You can also resolve or ignore in bulk for jobs that failed on the same action.
-
Dashboards: A home dashboard shows unresolved jobs and server metrics, with detail pages for jobs, schedules, and performance-metric history.
-
Server performance metrics: Tracks App Server CPU and memory utilization over time.
-
Database maintenance: Weekly schedules to reorganize and rebuild indexes, plus on-demand shrink-file and index actions and reports (largest tables, average fragmentation, and slowest queries).
-
Log maintenance: Truncate log tables, and analyze event history with a Gantt chart of execution times.
Prerequisites
To use Monitoring, you need the following:
-
A Jitterbit Harmony license with access to App Builder. This enables the Marketplace download; if your organization is not licensed for App Builder, the Download app action is replaced by a Get app request action (see Download and install).
-
An App Builder instance running App Builder 4.56, the version the current package is built for. Each package installs only on its exact App Builder version; if your instance is on a different version, contact Jitterbit support to request a matching package.
-
A Microsoft SQL Server database for your App Builder instance. The app's database-maintenance tools (shrink-file and index rebuild or reorganize) use SQL Server operations.
-
An outbound SMTP mail server, used to send failure notifications.
-
A service user account that you can add to the Administrator group. See Configuration and setup.
-
For App Server CPU and memory tracking, a Windows host, because enabling the metrics requires a change to Windows Performance Monitor permissions. See Troubleshooting.
Download and install
Download the app from Marketplace
-
Log in to the Harmony portal at https://login.jitterbit.com and open Marketplace.
-
Locate the app named Monitoring. You can use the search bar or, in the Filters pane under Type, select App to show only apps.
-
Click the app card to open the Details panel. Review the app's Requirements (the App Builder version and database it needs).
-
Click the app's Go to documentation link to open this documentation in a separate tab, and keep it open for reference.
-
Do one of the following, depending on whether your organization is licensed for App Builder:
-
Download app: If your organization is licensed for App Builder, click Download app, on either the app card or the Details panel. Your browser saves the
.LPfile to its download location, and an App Builder file downloaded successfully notification confirms the download. -
Get app: If your organization is not licensed for App Builder, the action is labeled Get app. The Details panel shows a message that an App Builder license is required, with a Submit button. Click Submit to send a request for a representative to contact you about App Builder; a Message successfully sent notification confirms it.
-
Install the app in App Builder
Install the downloaded .LP file into your App Builder instance:
-
Log in to App Builder and go to the IDE.
-
Under Deploy, click Install Release.
-
Click + Package, then Browse and select the
.LPfile you downloaded. -
Click Save. The Release panel displays the package information, then close the Package dialog.
-
Confirm the details are correct, then click Install.
To preview a package's contents before you install it, click the Manifest button.
Modifying the app in a development environment
The app's data source installs sealed. If you deploy the app to a development environment and intend to modify it, unseal the data source so you can edit the app's objects. Leave it sealed in QA and production to preserve equivalence across environments. See Seal or unseal a data source.
Configuration and setup
Complete the post-install steps
-
Add your service user to the Administrator group.
-
Open the Monitoring app and go to Configurations > App Config, then:
-
Enter the Root Server URL (for example,
https://community.zudy.host/Vinyl). -
Enter the From Email Address for SMTP.
-
Set the Vinyl Database and the Monitor Database.
-
Under Configuration Actions, click Import Users, Import Schedules, and Import Databases.
-
-
To track App Server CPU and memory utilization, follow the steps in Troubleshooting to grant App Builder access to the Windows metrics.
Configure notifications
After the import, set up the user groups that receive notifications:
-
Under Configurations > Users, verify that all users who need to be notified are present, and select the Email Notification checkbox for each user who should receive notifications. Only users with this checkbox selected can be added to user groups in the next step.
- If users are missing, they do not have a user account in this environment. Add them in the IDE, then re-import users to show them here.
-
Under Configurations > User Groups, create groups and add users to them.
-
Under Configurations > Schedule Groups, add groups to the schedules that should notify them when that schedule has an error.
- You can also add a notification group to a schedule from the schedule's popup page.
-
Under Configurations > Notification Templates, adjust the default template used for notification emails.
-
On the Home page, select the schedules you want to monitor.
Configure database maintenance
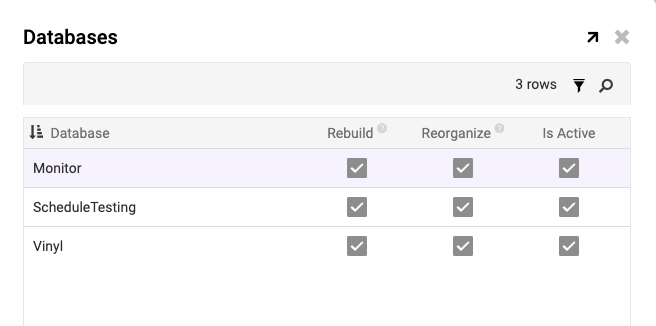
Two schedules rebuild or reorganize indexes for databases on the database server. Under Configuration > Databases, choose which databases are included in these schedules. After the Import Databases action runs, each imported database has its Rebuild, Reorganize, and Is Active options selected by default, so review the list and clear any you do not want maintained:
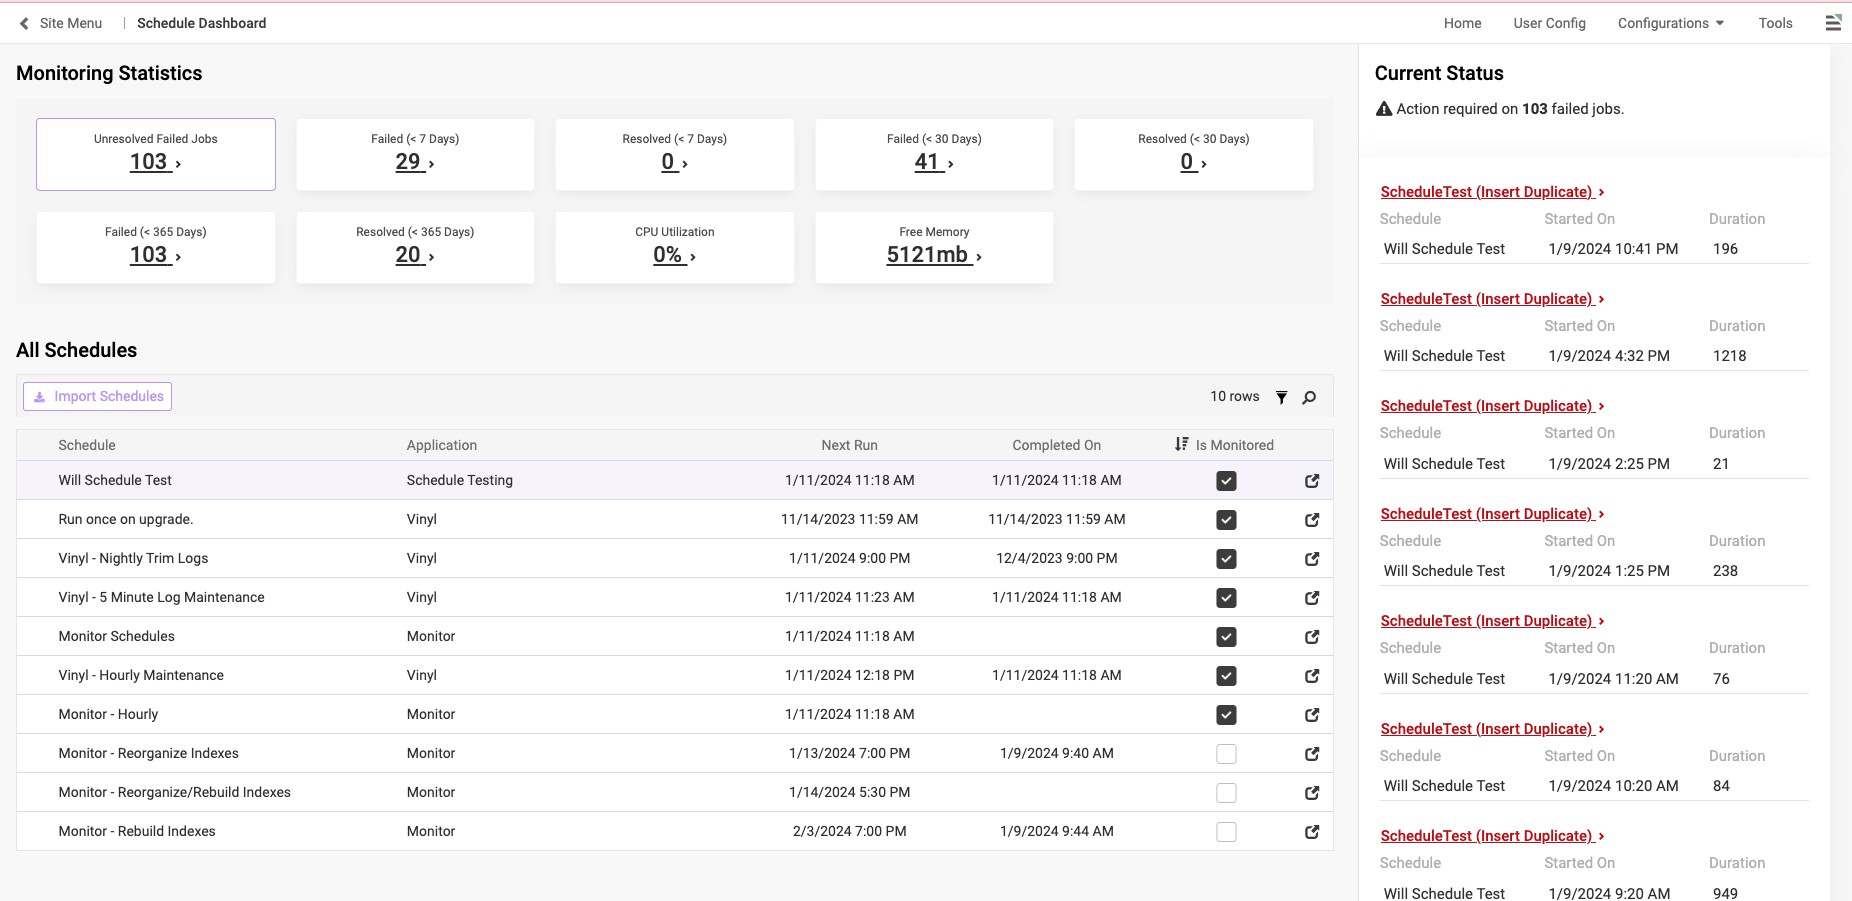
Once configured, the home page shows current statistics. You can turn the statistics on or off from Config > Statistics:
Note
You may not see any failed jobs if there have not been any, or if the schedule has not run yet.
Using the app
Home page
The home page provides a dashboard of current statistics for unresolved jobs and server metrics, the schedules that are imported and can be monitored, and a list of unresolved jobs. From it, you can reach:
-
Job Details: Information about failed jobs based on a selected filter.
-
Schedule Details: Information about a schedule, such as its notification groups and previously failed jobs.
-
Performance Metrics History: Historical App Server CPU and memory utilization.
Job details
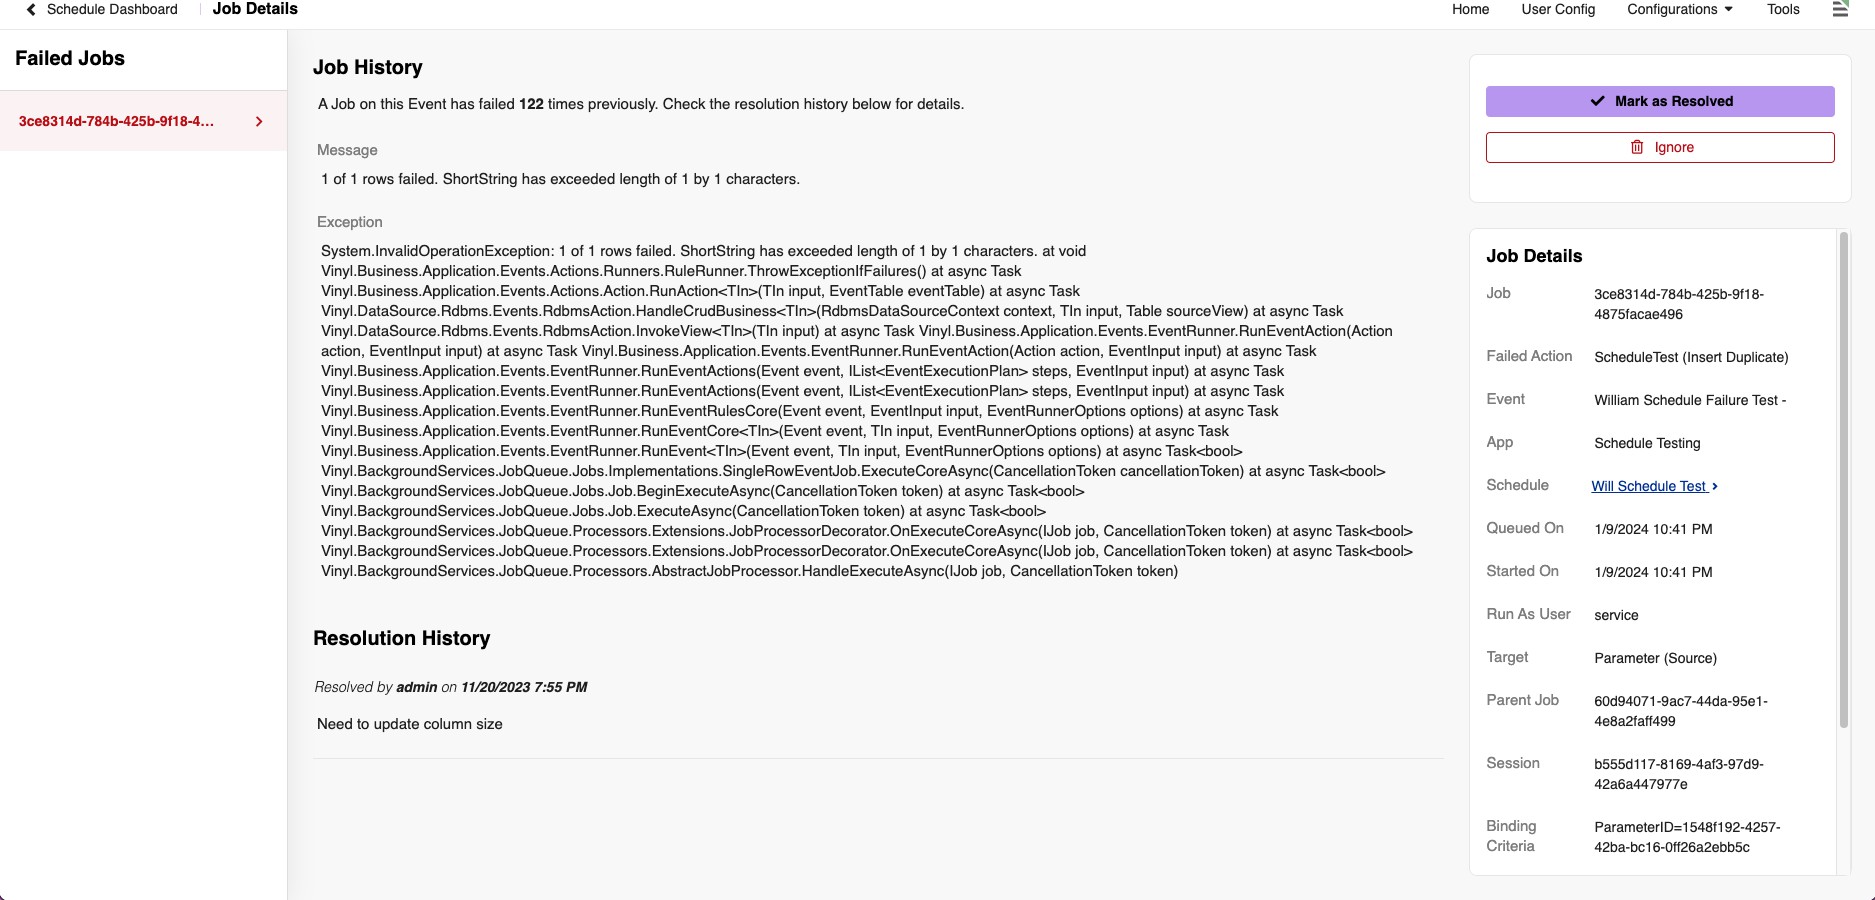
The Job Details page shows information about a selected failed job. You can review previous resolution notes, if any, and mark the job as resolved or ignore it. Marking a job as resolved stores the record locally for later reference.
Caution
Ignoring a failed job deletes it permanently.
The Bulk resolve/ignore option applies the same action (resolve or ignore) to any failed jobs that failed on the same action as the one selected.
Schedules
-
Monitor Schedules: The main schedule the app requires to function. It loops through each schedule set to be monitored, checks App Builder's internal job table for failures in the past 24 hours, records new failures and schedules locally, and updates the last run time for each monitored schedule.
-
Monitor App Server Utilization: Runs a custom plugin to collect App Server CPU and memory utilization and store it locally.
Note
In most cases, you must perform the actions in Troubleshooting for this to work.
-
Monitor Reorganize Indexes: A weekly schedule that reorganizes indexes for the databases flagged for it.
-
Monitor Rebuild Indexes: A weekly schedule that rebuilds indexes for the databases flagged for it.
Tools
The toolbar menu includes stored procedures to run against specific databases, and corresponding reports. Tabs indicate which database the procedures target and when each was last run.
App Builder
-
Truncate logs: Delete the table that stores the logs (history) for a category.
-
Event History Analyzer:
-
Event Details: A complete list of events run, including successes, failures, maximum, minimum, and average durations, and last execution.
-
Event History: A Gantt chart of event execution times, filterable by date and duration, to help identify overlapping events that may have caused a failure.
-
Database maintenance
-
Database: A dropdown of all databases connected to the app, used to choose which one the actions and reports run against.
-
Actions:
-
Shrinkfile (1): Shrinks the database's data file by reclaiming and compacting free space.
-
Shrinkfile (2): Does the same for the log file.
-
Reorganizing Indexes: Defragments the leaf level of clustered and non-clustered indexes and compacts the index pages.
-
Rebuilding Indexes: Drops and re-creates the index, removing fragmentation and reclaiming disk space.
-
-
Reports: Runs against the selected database: the ten largest tables (used and allocated MB), average fragmentation of all tables, and, across all databases, the top 50 slowest queries.
Monitor app
Three actions purge the performance metrics for different time periods, clearing all records within that period.
History
Shows the last execution date of all the database procedures (but not the reports).
Troubleshooting
Performance metrics fail with a registry key error
-
Symptom: Running the performance metrics returns the error
Access to the registry key 'Global' is denied. -
Resolution: Grant the application pool user access to the Windows performance counters:
-
Open Computer Management > Local Users and Groups > Groups > Performance Monitor Users, then add the application pool user account (for example,
IIS AppPool\DefaultAppPool). -
Repeat for the Performance Log Users group.
-
Restart IIS.
-
For further help, review your App Builder logs and contact Jitterbit support.