Test a script in Jitterbit Studio
Introduction
Test mode offers basic debugging functionality where you can test the results of a script by entering values to test as input to the script.
Be aware that depending on the contents of a script, sometimes a script can fail when testing but still run successfully when deployed and executed on an agent. This may happen if, for example, you do not have a default value set for a global variable that obtains its value when running.
The script used for testing has a size limitation of 51200 bytes. This limit does not apply beyond testing.
Use breakpoints
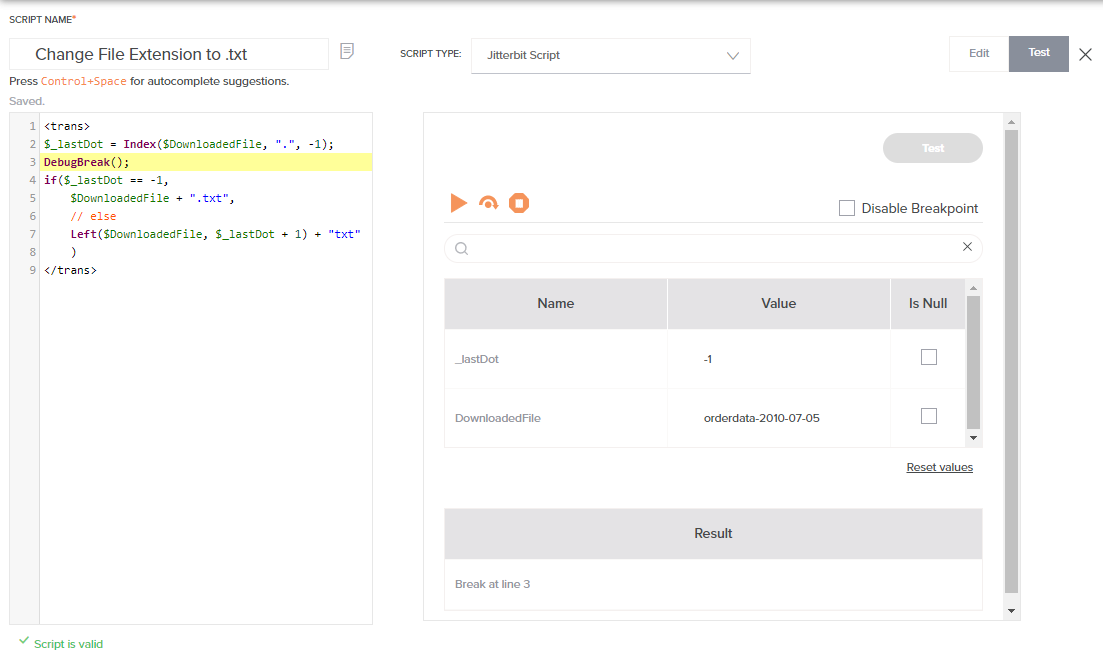
In Jitterbit Scripts, you can use the function DebugBreak, which acts as a breakpoint for the script execution. When a script is tested, the Jitterbit Script engine stops execution when it reaches a call to DebugBreak. It sends back information about the current state to the client, including the values of all data elements, both source data elements and global data elements. This provides a powerful way to test the logic you put in the script.
The function DebugBreak optionally accepts a boolean value. If true, execution breaks at the statement when testing. If false, the breakpoint is ignored when testing. This allows you to set up sophisticated testing scenarios that are controlled by input variables, allowing you to test parts of a script depending on settings. For more information on how to use DebugBreak, see Debugging functions.
In JavaScripts, you can see and validate the values of variables just as you would for Jitterbit Scripts. However, debugging is not available in JavaScript and using breakpoints is not supported.
Run a test
Within the script editor, use the Edit/Test toggle (or Test button in the script pad) to select Test mode:
Then click the Run test button to run a test:
Run test
Deployment considerations
When you click the Run test button, a deployment dialog is displayed if a script calls other project components that have not been deployed or have changed since last being deployed. The dialog shown depends on the validity of the referenced components.
-
Deploy required: If all referenced components are valid, the dialog contains a list of the components that require deployment for script testing. Click Deploy and test to deploy the listed components and run the test:
Dialog text
Deploy required
Testing this script requires deploying these components:Component type
Component 1
Deploy and testCancelClick Cancel to close the dialog without deploying the listed components. The test will not run.
-
Unable to deploy: If referenced components are invalid, the dialog contains a list of the invalid components and why they are invalid. The invalid items must be addressed to successfully run the test. Click Continue to close the dialog:
Dialog text
Unable to deploy
Your project cannot be deployed due to the following invalid item(s). Please correct these errors and try again:Component 1
Explanation why the component is invalid.
Continue -
Deploy project: If undeployed standalone scripts (not associated with an operation) or project variables are referenced, the dialog contains a list of what needs to be deployed with a project deployment to successfully run the test. Click Continue to close the dialog:
Dialog text
Deploy project
These items have been changed since the last deploy. Please deploy the project first.Component type
Component 1
Continue
See Deploy and execute an operation and Deploy a project for more information on deployments. If no deployments are required, no deployment dialogs will appear and the test will run automatically.
Test interface
When running a test, relevant information is displayed in a table containing each variable used in the script with resizable columns:
-
Name: The name of the variable. If the name is larger than the current column size, it is truncated by default and visible as a tooltip on hover.
A Copy name to clipboard button is also shown on hover for convenience.
-
Value: The current value of the variable. Select to edit the value of the variable when the script is not running. If the value is larger than the current column size, it is truncated by default and visible as a tooltip on hover.
If the value isn't
null, a Copy value to clipboard button is also shown on hover for convenience. -
Is Null: Indicates if the variable is
null. Select to set the value of the variable tonullwhen the script is not running.
When a test is started or resumed, any new values are sent back to the script engine.
You can walk through the debugging process using the controls along the top of the table:
| Control | Description |
|---|---|
| Resume: When the test is stopped, this resumes the test. The test runs until it either comes to another breakpoint or until it has completed. | |
| Next: When the test is stopped, this runs only the next statement of the script. This allows you to step through the script line by line. | |
| Stop: This stops the current test. |
You also have the option to toggle off breakpoints. Enable Disable Breakpoint if you want the test to ignore all calls to DebugBreak and instead run to completion. This option is applicable for Jitterbit Scripts only.
To search for a particular variable by name, use the search box to enter a keyword or multiple keywords separated by commas. Variables that have any part of the keywords in the variable name are returned.
To reset all values, click the Reset values button above the table.
Finally, the Result is shown in second table that appears below the first:
- Jitterbit Script: The Result table displays the resulting output of the last statement of the script (if no breakpoints are present), or the resulting output after each breakpoint.
- JavaScript: The Result table displays the results of the script as set by either the
SetScriptOutputorSetScriptResultfunctions.
In addition, any error messages incurred during the testing are also displayed.