Analytics in Jitterbit EDI
Introduction
The Jitterbit EDI Analytics page has two tabs for the following transaction reports:
-
Transaction volume report: A chart showing the total number of transactions over time, with options to view data grouped by trading partner, document type, or status, or as a total count. Supports switching between bar chart and line chart views.
-
Transaction activity report: A table of transaction summary information showing the total number of transactions, with subtotals for inbound and outbound transactions.
The Analytics page saves your most recently selected view and filter options and restores them when you return to the page.
Transaction volume report
The Transaction volume report displays a chart of transaction volumes for the selected date range and filters:
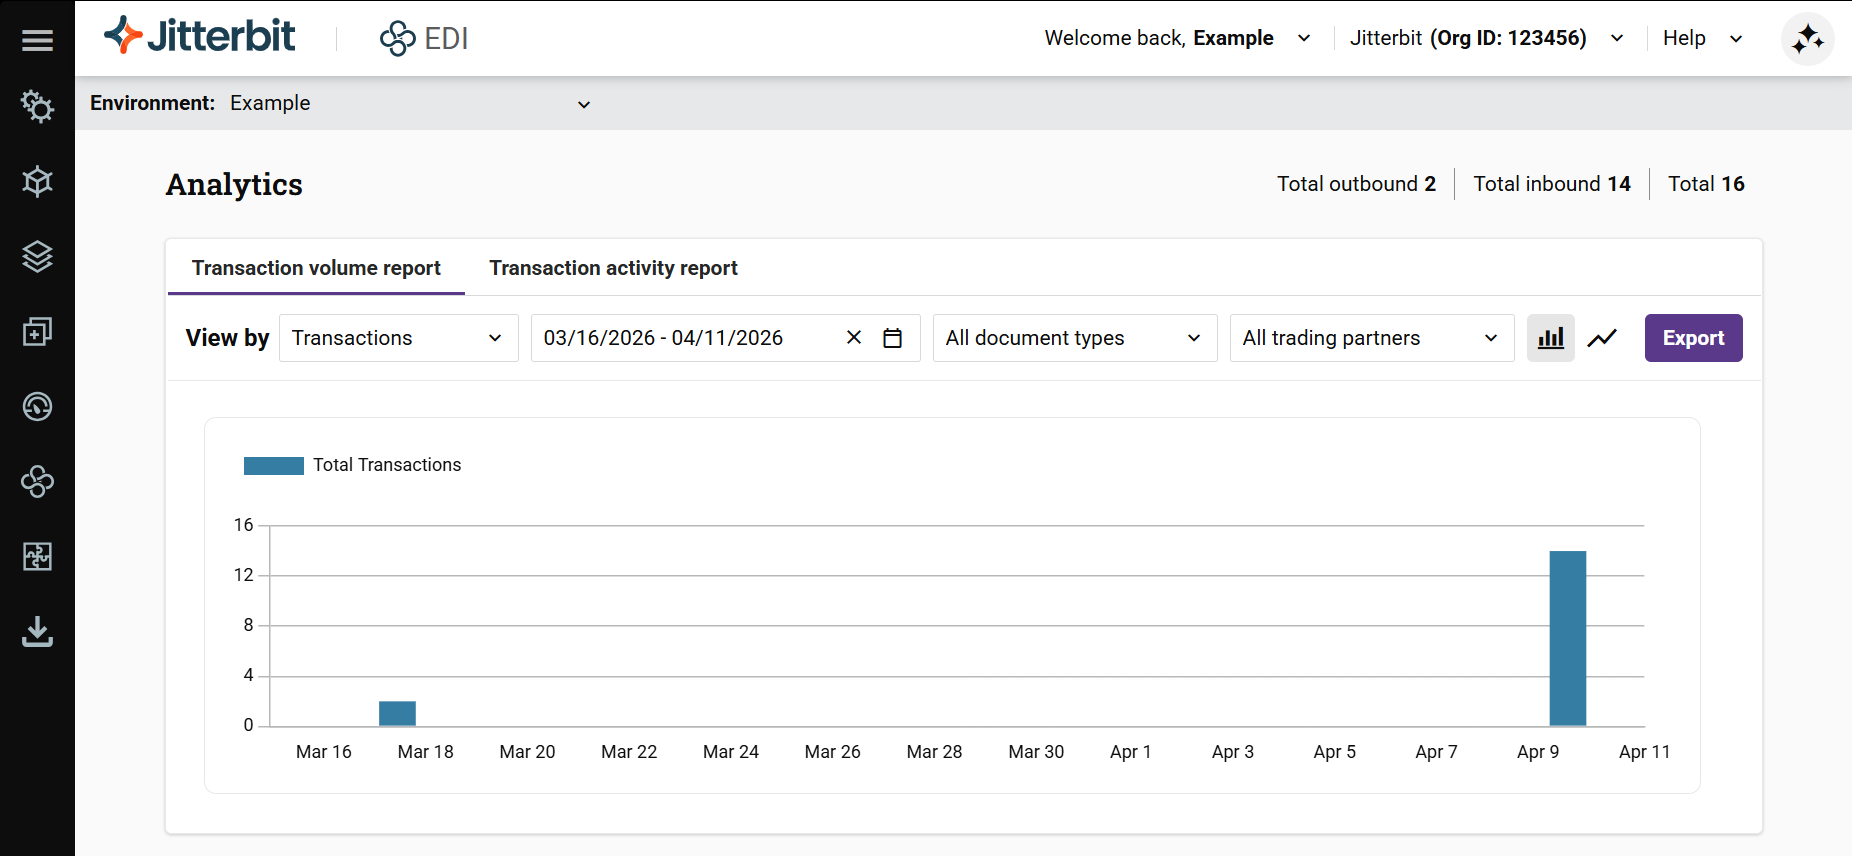
The chart includes a color-coded legend for the currently selected grouping. When no data is available for the selected filters, the chart displays No Data to Display.
Chart type
Use the and buttons in the top-right corner of the chart to switch between a bar chart and a line chart. The bar chart is the default. The selected chart type applies to all View by options.
View by options
Use the View by dropdown to select one of the following views:
-
Transactions: Displays the total transaction count without grouping. The default date range is the last month.
-
Trading partner: Groups transaction data by trading partner, with each trading partner represented by a distinct color in the chart. Hovering over a segment displays the total transaction count for that partner and a breakdown of transaction types and their counts.
-
Document type: Groups transaction data by document type, with each document type represented by a distinct color in the chart. Hovering over a segment displays the total transaction count for that document type and a breakdown of trading partners and their counts.
-
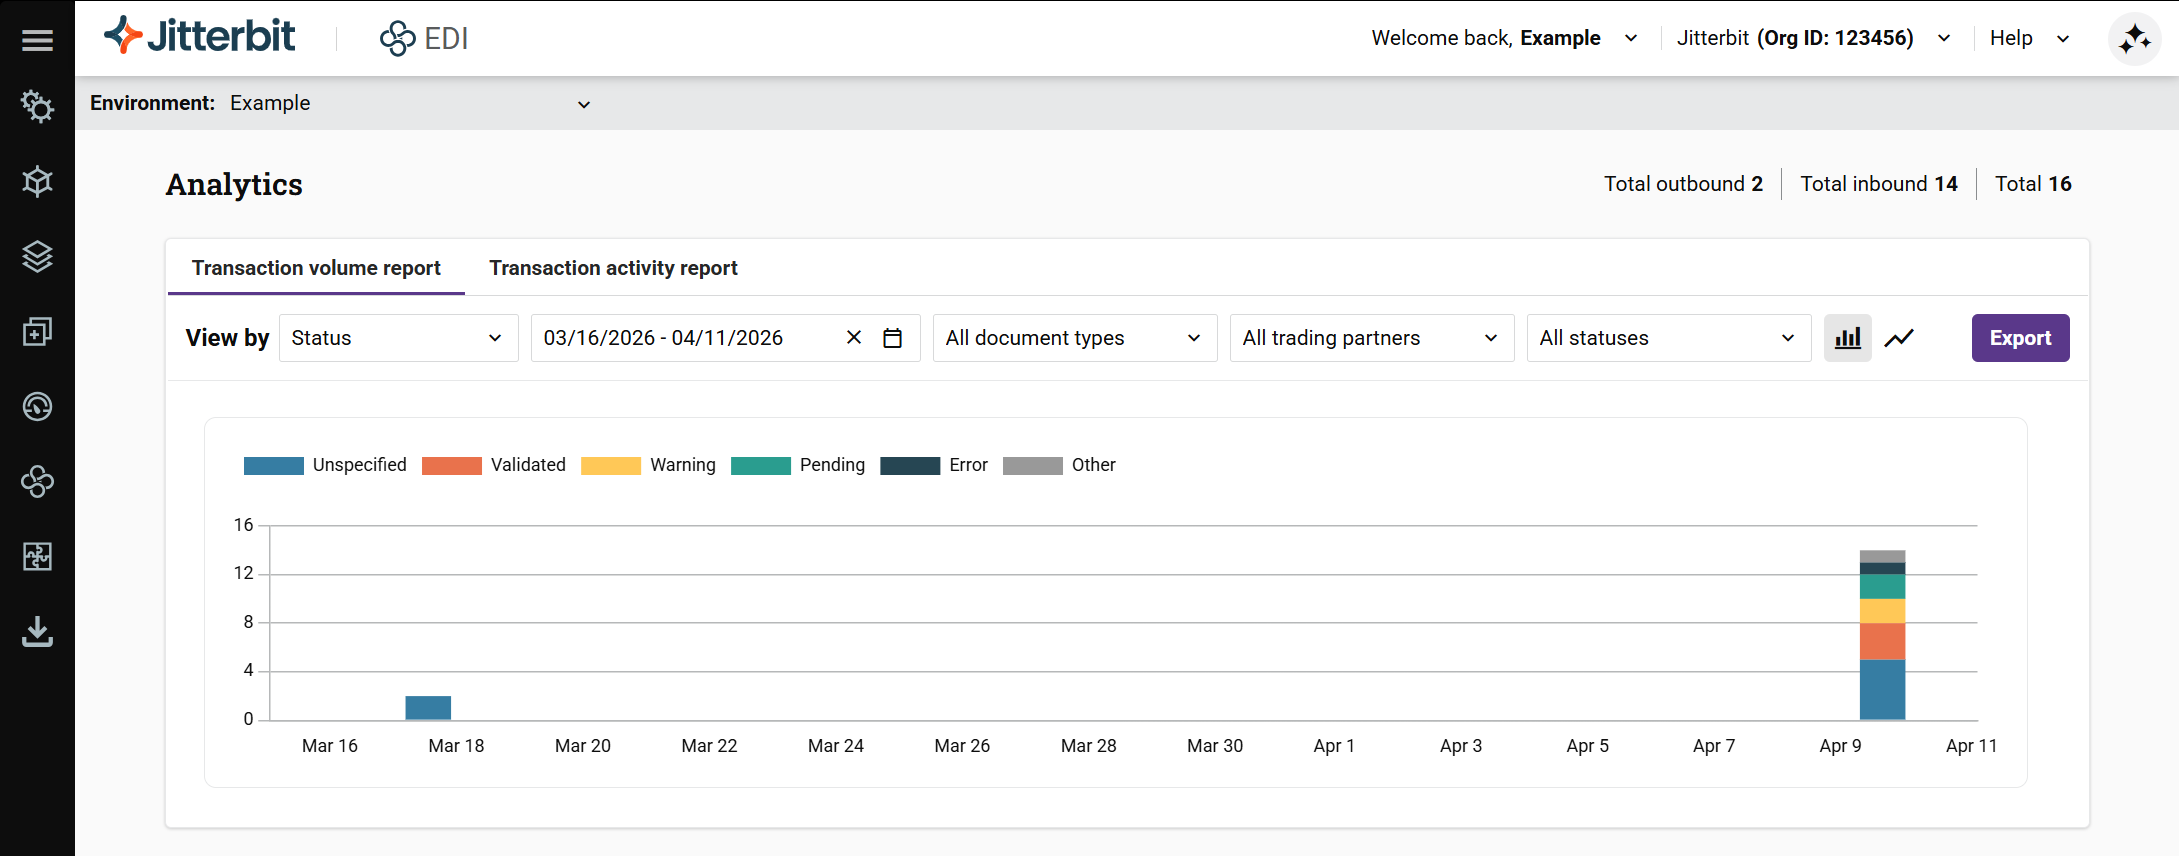
Status: Groups transaction data by transaction status, with each status represented by a distinct color in the chart. Hovering over a segment displays the total transaction count for that status.
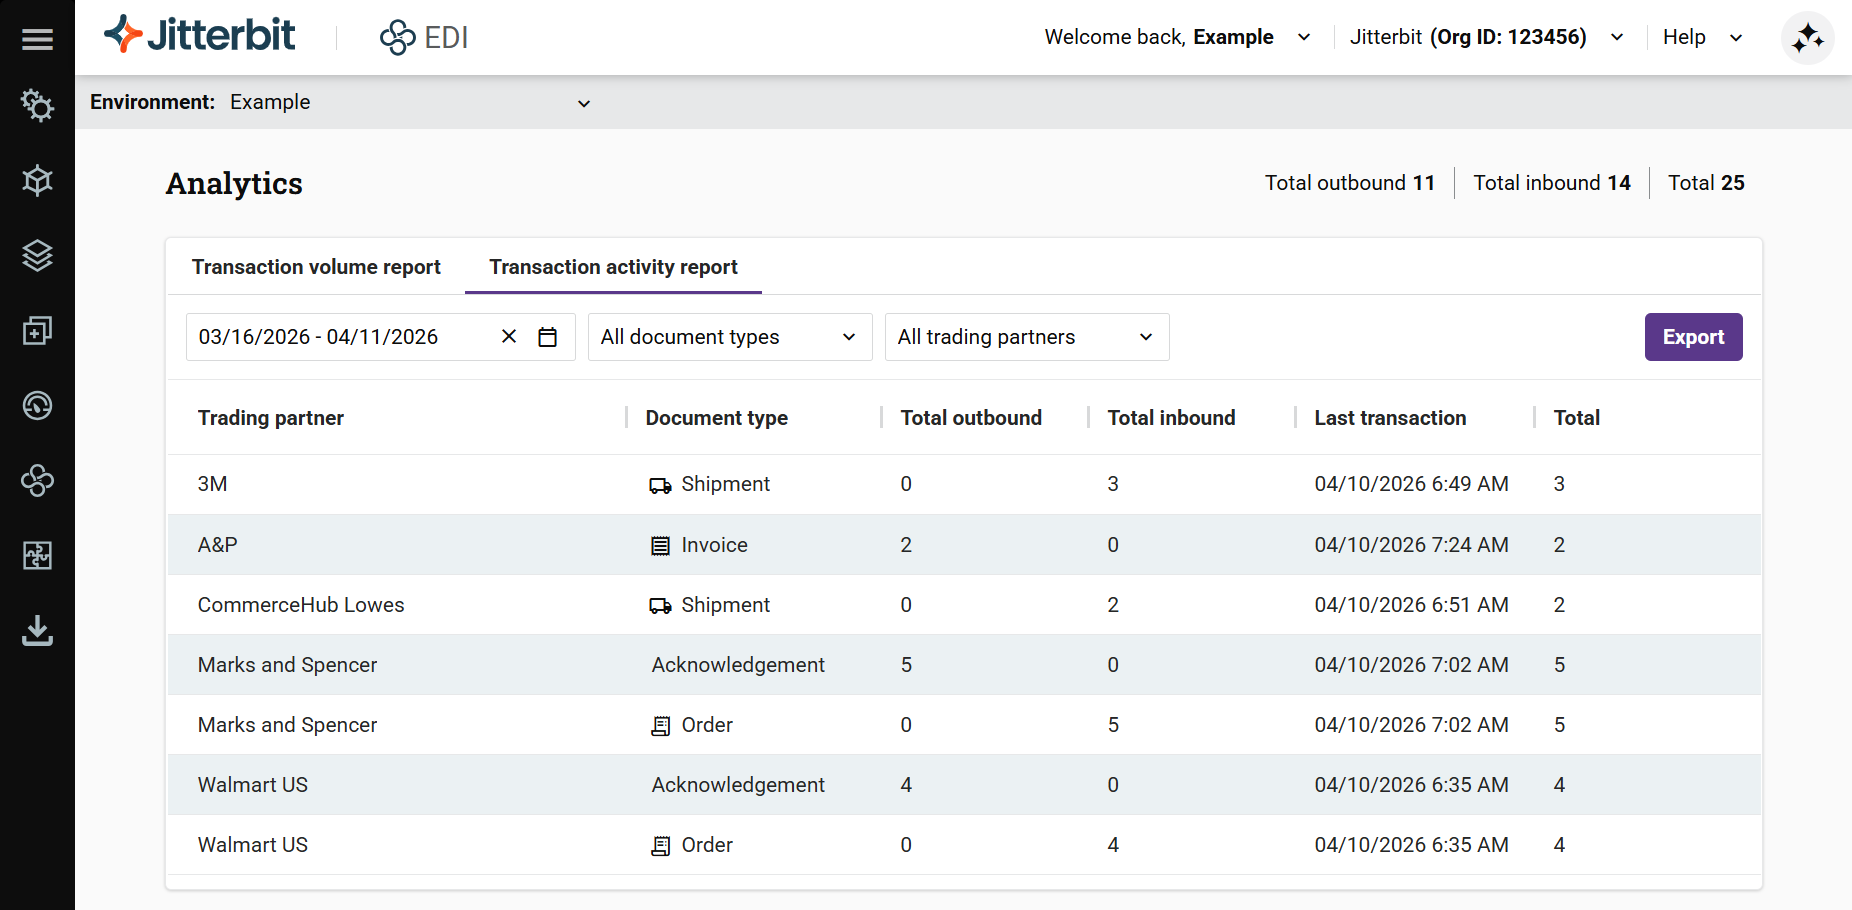
Transaction activity report
The Transaction activity report is a table showing how many inbound and outbound transactions were transferred for the selected date range, trading partners, and document types filters:
Filters
To filter the reports by date, document type, trading partner, or status, use any of the following controls individually or in combination:
-
Date filter: Click to open the filter, then select one of the date range options on the Relative tab, or select a date range from the Absolute tab. The default date range varies depending on the selected view.
-
Document type: Click to open the filter, then select individual document types, or all document types.
-
Trading partners: Click to open the filter, then select individual partners, or all partners.
-
Status: (Available only in the Transaction volume report when viewing by Status.) Click to open the filter, then select individual statuses or all statuses. All system and user-defined statuses are selected by default.
Export
To export a report as a PDF file, click the Export button.