Analytics in Jitterbit EDI
Introduction
The Jitterbit EDI Analytics page has two tabs for the following transaction reports:
-
Transaction volume report: A bar chart showing the total volume of transactions against time.
-
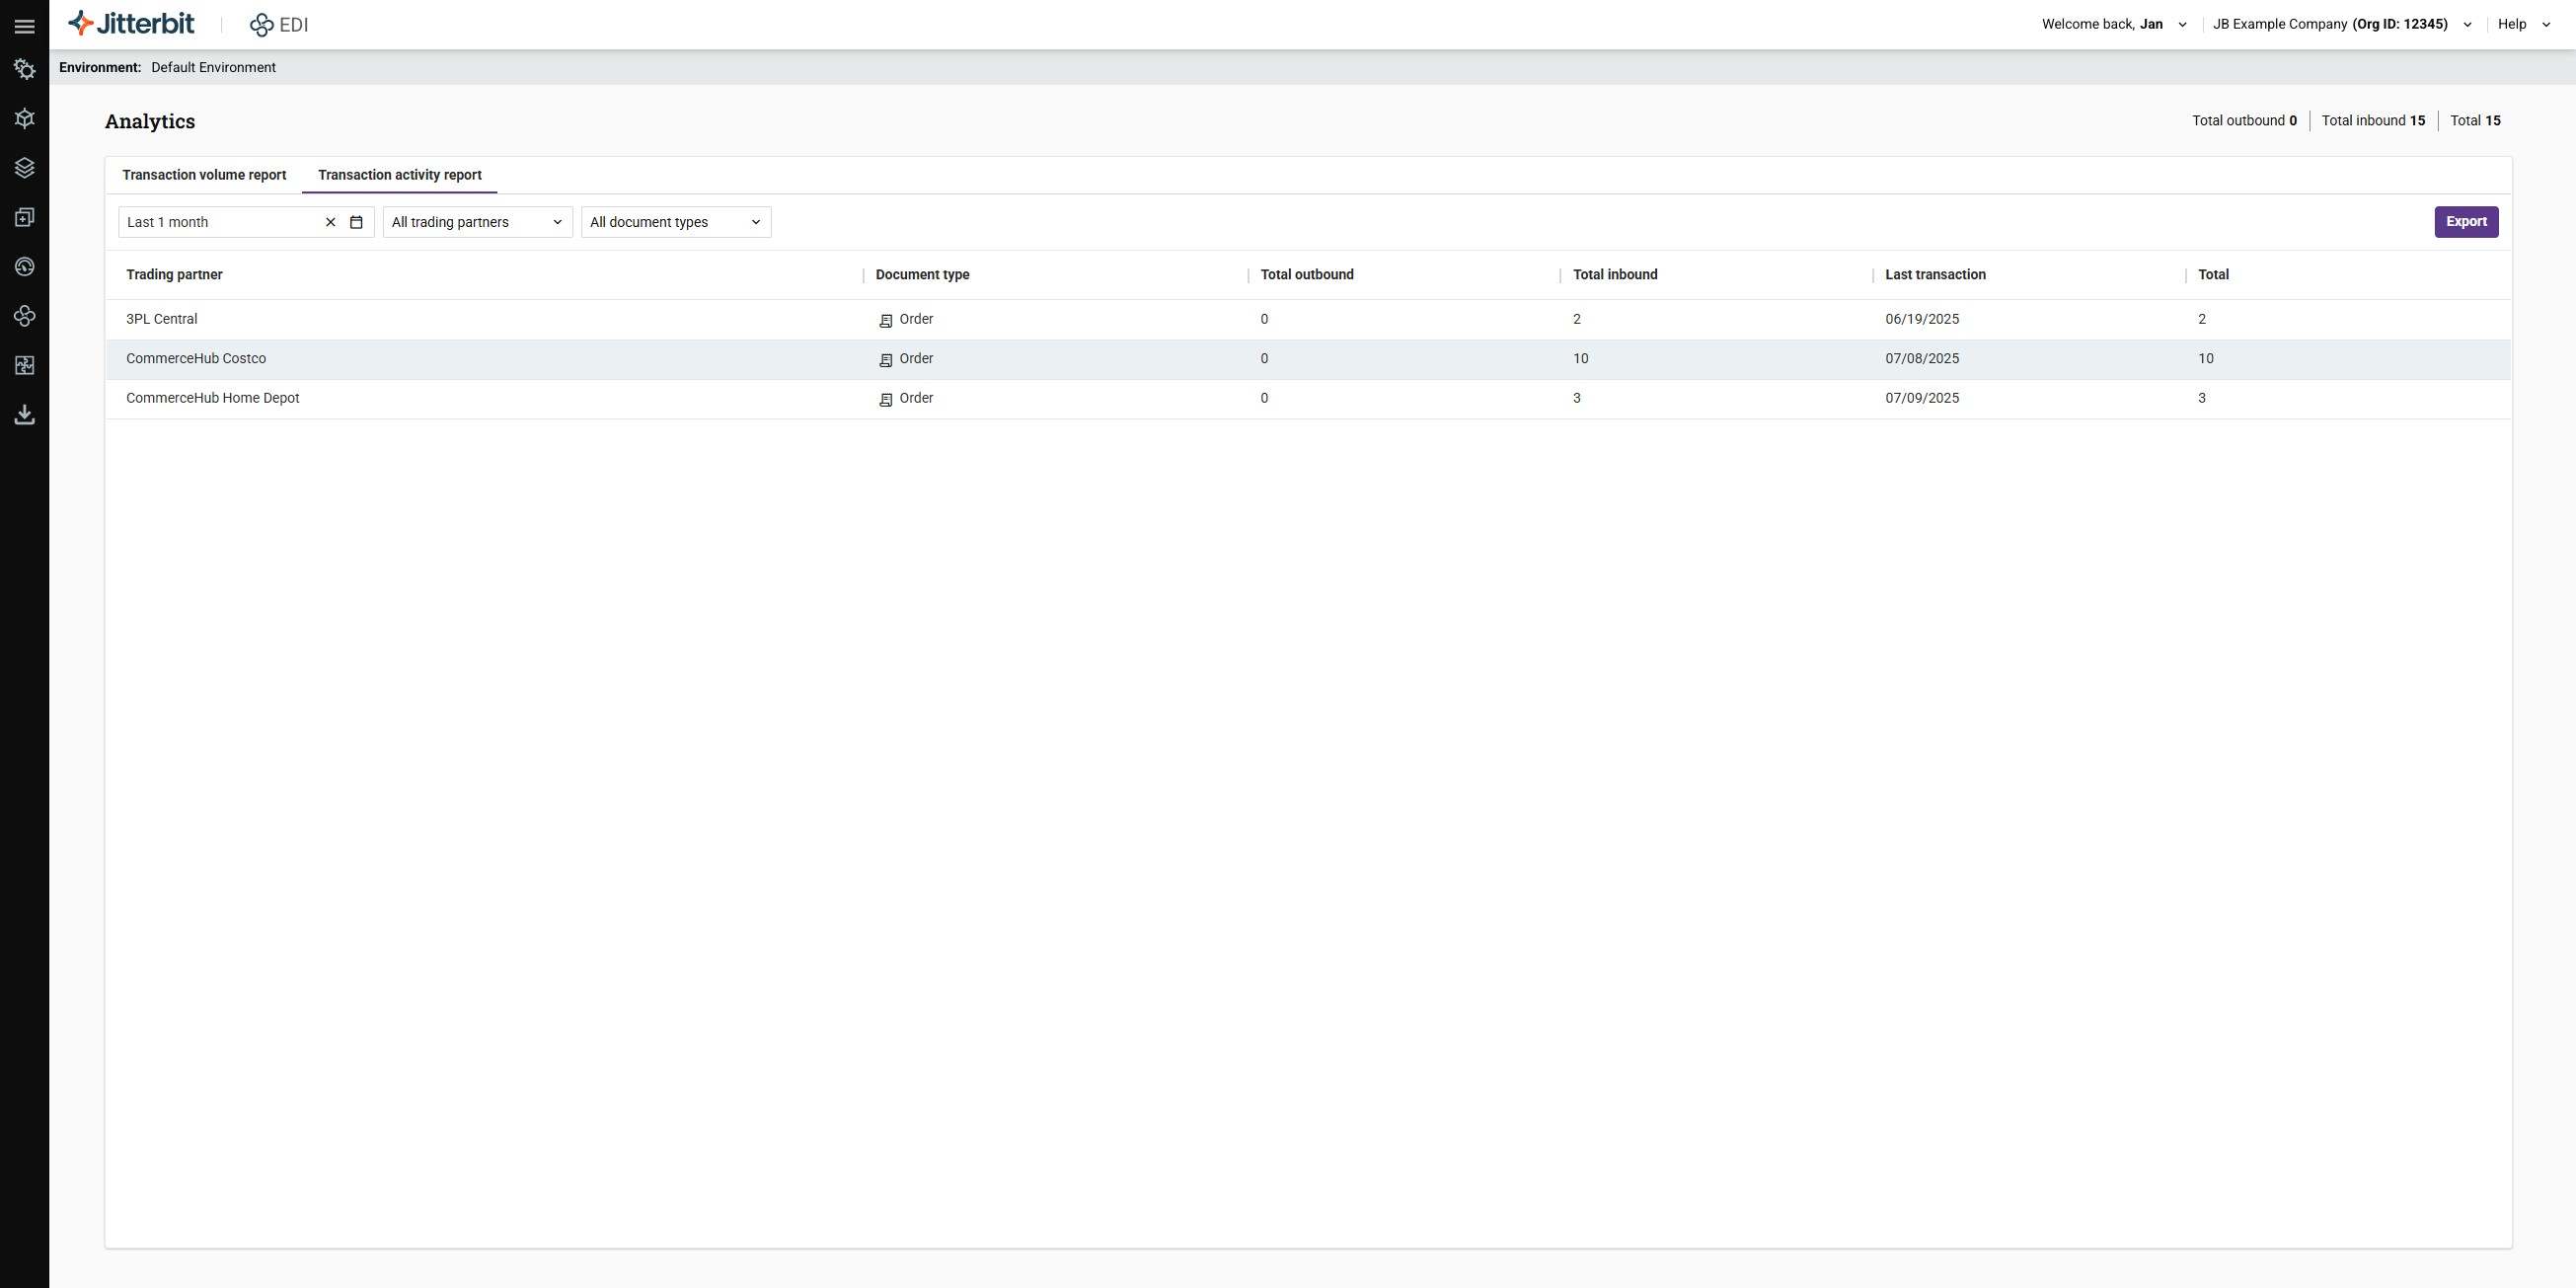
Transaction activity report: A table of transaction summary information showing the total number of transactions, with subtotals for inbound and outbound transactions.
Transaction volume report
The transaction volume report is a bar chart showing the total number of transactions for the selected date range, partner names, and document types filters:
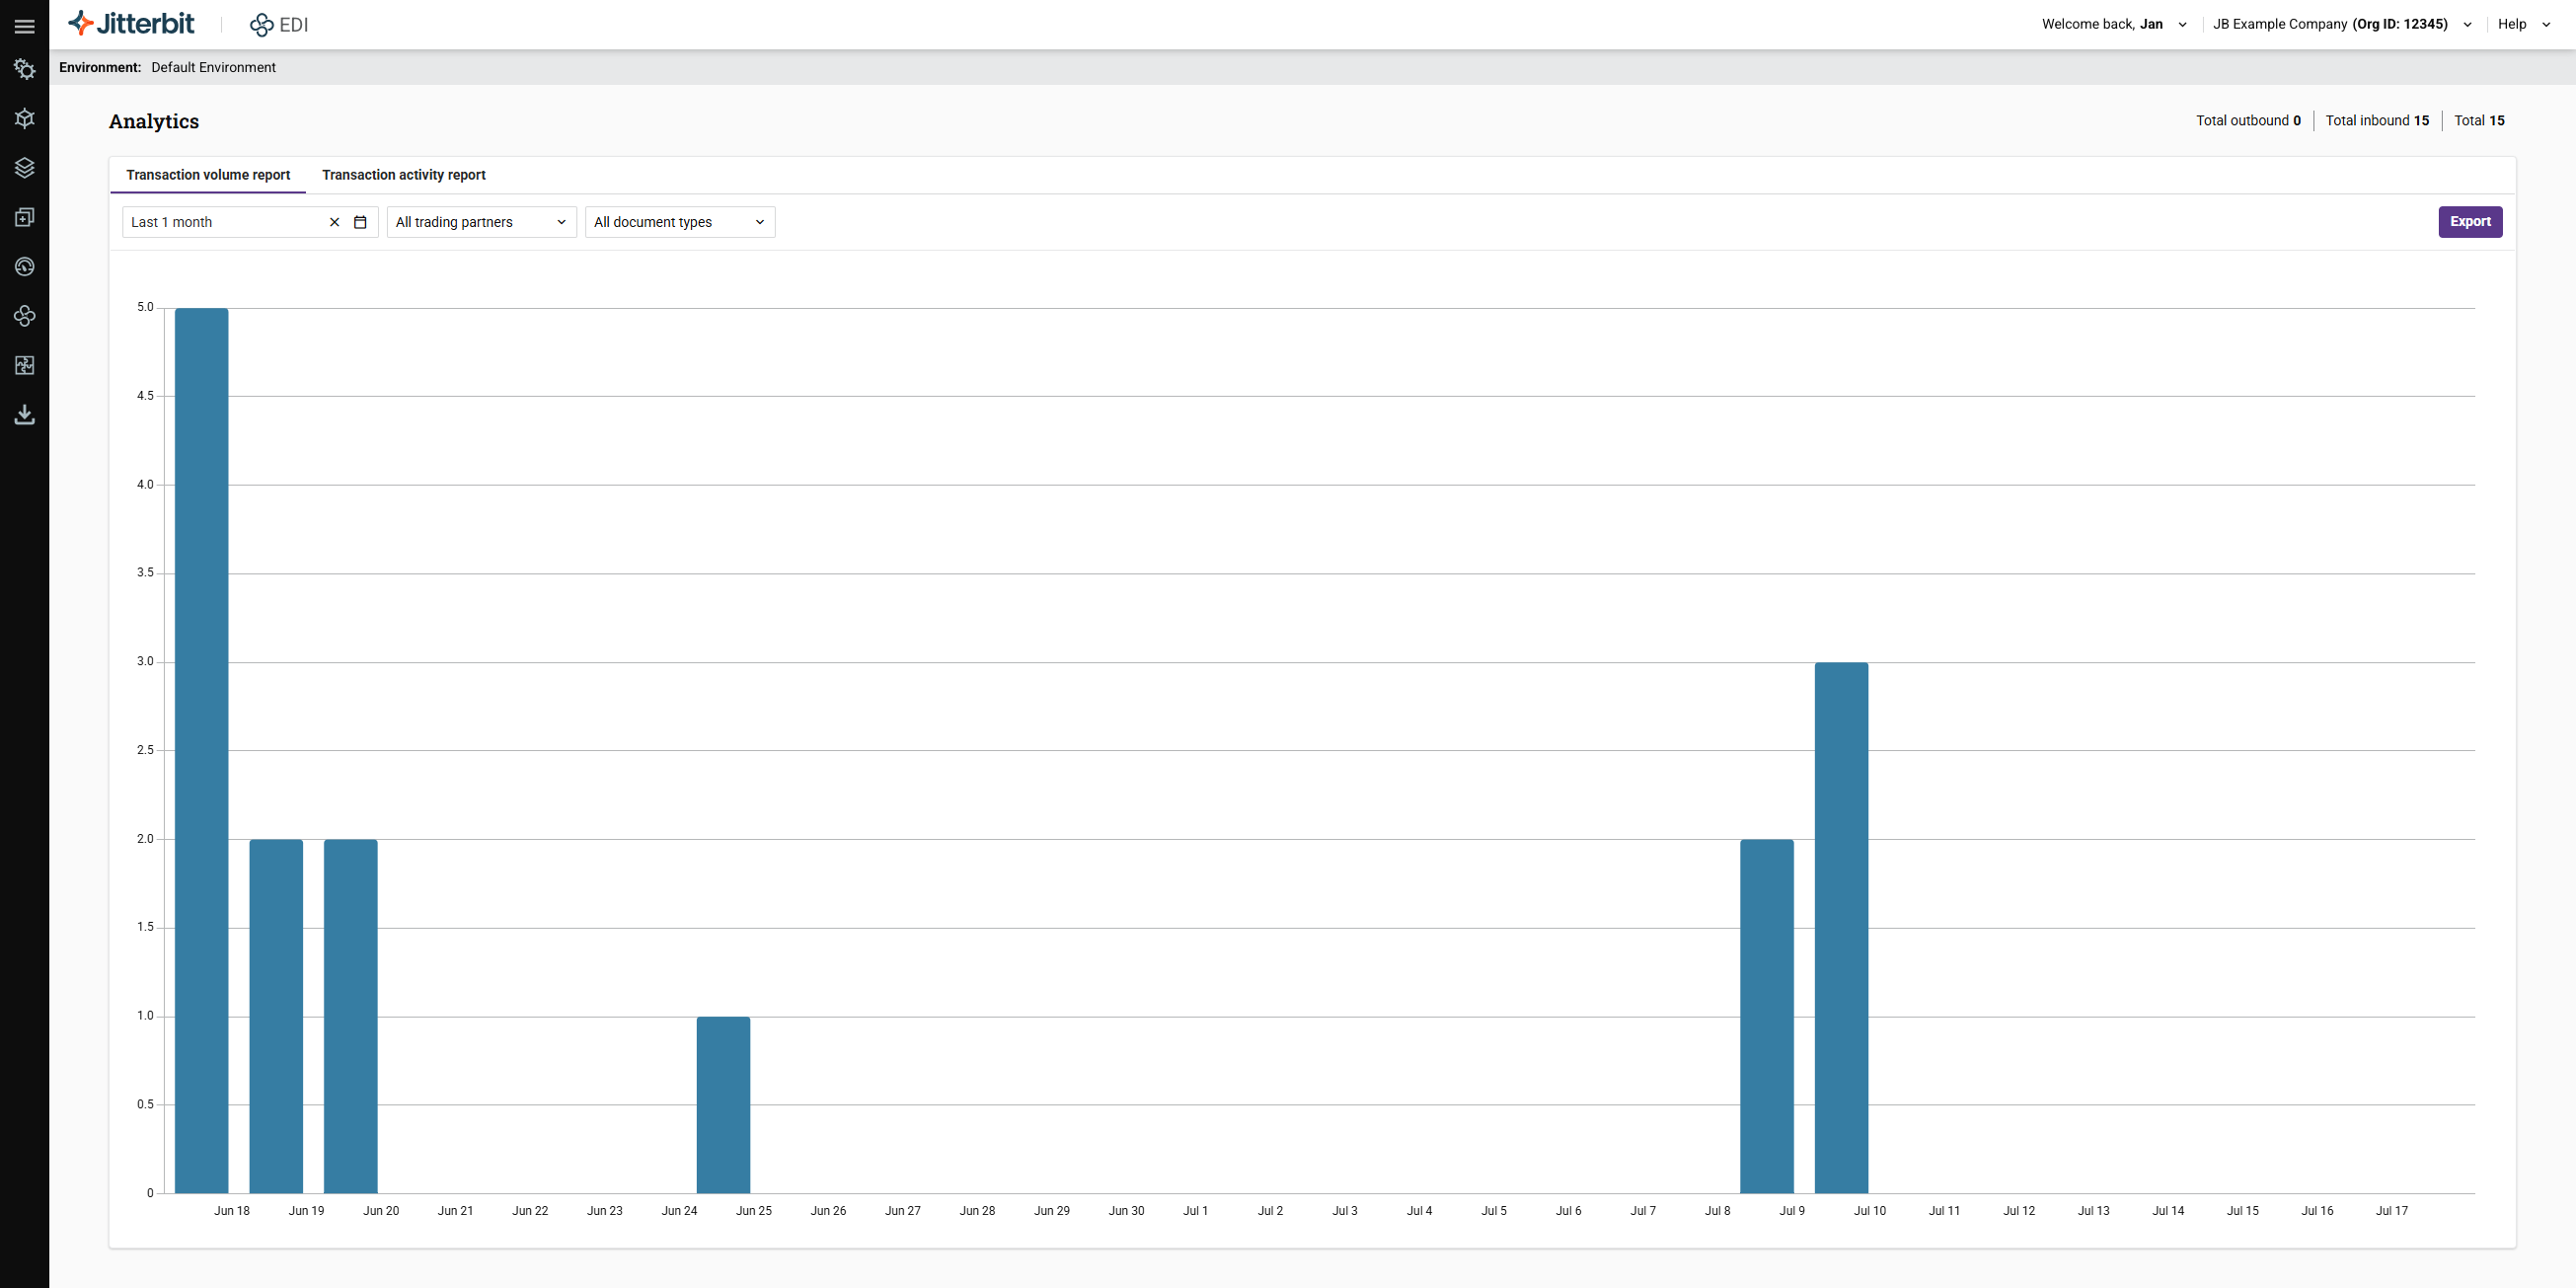
To move the chart, click and move the image.
To zoom the chart, use the scroll function on your mouse or track pad.
Transaction activity report
The transaction activity report is a table showing how many inbound and outbound transactions were transferred for the selected date range, partner names, and document types filters:
Filters
To filter the reports by date, partner name, or document type, use any of the following controls individually or in combination:
-
Date filter: Click to open the filter, then select one of the date range options on the Relative tab, or select a date range from the Absolute tab. The default date range is the last 3 months.
-
Partner name: Click to open the filter, then select individual partners, or all partners.
-
Document type: Click to open the filter, then select individual document types, or all document types.
Export
To export a report as a PDF file, click the Export button.