Jitterbit App Builder performance tuning
Introduction
Before investing in platform upgrades to improve performance, you should optimize your App Builder apps.
App optimization
You can use tools such as EXPLAIN ANALYZE to inspect query execution plans. Browser developer tools can help you find issues with requests that aren't getting answered or handled correctly.
Indexes
In SQL, an index improves the performance of queries by helping to fetch data faster. This is done by reducing the number of database data pages that have to be visited or scanned.
You should ensure that all columns used in WHERE, ORDER BY, or JOIN clauses are properly indexed, and try to create enough indexes to speed up SELECT queries without creating redundant indexes that might slow down UPDATE or DELETE operations.
Index architectures are classified as clustered or non-clustered. Clustered indexes are indexes whose order of the rows in the data pages correspond to the order of the rows in the index. A table can have only one clustered index but many non-clustered indexes.
In App Builder, indexes are created on table objects. Every table should have a clustered index. The primary key for each table and any unique key columns that exist should be indexed. Tables with missing indexes be the cause of a slow application.
When modifying indexes in App Builder, keep in mind the following key points:
-
Adding indexes will speed up queries, but slow down
INSERT/UPDATE/DELETEstatements. You should try to find a balance between optimizing too much for either read or write operations. -
You should consider indexing columns that you use to order by and those that you use in a grouping expression. You might benefit from indexing the columns that the
MIN(),MAX(),COUNT(),SUM(), andAVG()functions use to aggregate the data. -
You can take advantage of "covering indexes", where you have one bigger index that can be leveraged by queries that use subsets of the columns. The order of columns in the index is important. The recommendation is for the inequality columns to come after equality columns in your covering indexes.
WHERE clauses
WHERE clauses define the search condition of SQL statements.
When poorly written, they can result in slow queries. Good WHERE clauses should be efficient and include the right indexes.
These queries are bad because indexes are not used:
-
Where LOWER(FirstName) like '%Bob% -
Where NOW() > DATEADD(minutes,60,StartTime)
These example use indexes, so run faster:
-
Where FirstName like 'Bob%' -
Where DateAdd(minutes,-60,NOW()) > StartTime
Tip
Use the trace mode and query plan utilities in MS SQL Server to see if indexes are being used.
Settings to improve performance
You can use the following App Builder settings to improve performance:
-
Avoid searching, filtering, or sorting on columns in large tables that are not indexed. When searching indexed fields, App Builder generates index-friendly queries:
...FirstName like 'Bob%'... Will match: "Bob Smith" Will not match: "Mr Bobert" -
At the panel level, enable Support Download, Simple Search On, and Indexed Only.
Missing index tools
Dynamic management views (DMVs) are SQL Server utilities that return server state information and can be used to monitor the health of your database server and diagnose problems. DMVs give great insight about what is going on inside SQL Server. Running these requires VIEW DATABASE STATE permission on the database in question.
You can identify missing indexes in these ways:
-
Run the Database Engine Tuning Advisor.
-
Execute Missing Index Dynamic Management Views.
-
Respond to the SQL Server Engine prompts about missing indexes when generating Execution Plans in SSMS.
Examples
Following example SQL queries can help identify issues with indexes.
Example 1: Find long running queries
SET TRANSACTION ISOLATION LEVEL READ UNCOMMITTED
SELECT TOP 20
CAST(qs.total_elapsed_time / 1000000.0 AS DECIMAL(28, 2))
AS [Total Duration (s)]
, CAST(qs.total_worker_time * 100.0 / qs.total_elapsed_time
AS DECIMAL(28, 2)) AS [% CPU]
, CAST((qs.total_elapsed_time - qs.total_worker_time)* 100.0 /
qs.total_elapsed_time AS DECIMAL(28, 2)) AS [% Waiting]
, qs.execution_count
, CAST(qs.total_elapsed_time / 1000000.0 / qs.execution_count
AS DECIMAL(28, 2)) AS [Average Duration (s)]
, SUBSTRING (qt.text,(qs.statement_start_offset/2) + 1,
((CASE WHEN qs.statement_end_offset = -1
THEN LEN(CONVERT(NVARCHAR(MAX), qt.text)) * 2
ELSE qs.statement_end_offset
END - qs.statement_start_offset)/2) + 1) AS [Individual Query]
, qt.text AS [Parent Query]
, DB_NAME(qt.dbid) AS DatabaseName
, qp.query_plan
FROM sys.dm_exec_query_stats qs
CROSS APPLY sys.dm_exec_sql_text(qs.sql_handle) as qt
CROSS APPLY sys.dm_exec_query_plan(qs.plan_handle) qp
WHERE qs.total_elapsed_time > 0
ORDER BY qs.total_elapsed_time DESC
Example 2: Identify the most important missing indexes
SET TRANSACTION ISOLATION LEVEL READ UNCOMMITTED
SELECT TOP 20
    ROUND(s.avg_total_user_cost *s.avg_user_impact*  (s.user_seeks + s.user_scans),0) AS [Total Cost]
    , d.[statement] AS [Table Name]
    , equality_columns
    , inequality_columns
    , included_columns
FROM sys.dm_db_missing_index_groups g
    INNER JOIN sys.dm_db_missing_index_group_stats s
        ON s.group_handle = g.index_group_handle
    INNER JOIN sys.dm_db_missing_index_details d
        ON d.index_handle = g.index_handle
WHERE d.database_ID = DB_ID()
ORDER BY [Total Cost] DESC
Example 3: Identify unused indexes
SET TRANSACTION ISOLATION LEVEL READ UNCOMMITTED
SELECT
    DB_NAME() AS DatabaseName
    , SCHEMA_NAME(o.Schema_ID) AS SchemaName
    , OBJECT_NAME(s.[object_id]) AS TableName
    , i.name AS IndexName
    , s.user_updates
    , s.system_seeks + s.system_scans + s.system_lookups AS [System usage]
INTO    #TempUnusedIndexes
FROM    sys.dm_db_index_usage_stats s
    INNER JOIN sys.indexes i
        ON s.[object_id] = i.[object_id]
        AND s.index_id   = i.index_id
    INNER JOIN sys.objects o
        ON i.object_id   = O.object_id
WHERE     1=2

EXEC sp_MSForEachDB 'USE [?];
INSERT INTO #TempUnusedIndexes
SELECT TOP 20
    DB_NAME() AS DatabaseName
    , SCHEMA_NAME(o.Schema_ID) AS SchemaName
    , OBJECT_NAME(s.[object_id]) AS TableName
    , i.name AS IndexName
    , s.user_updates
    , s.system_seeks + s.system_scans + s.system_lookups
    AS [System usage]
FROM    sys.dm_db_index_usage_stats s
    INNER JOIN sys.indexes i
        ON s.[object_id] = i.[object_id]
        AND s.index_id = i.index_id
    INNER JOIN sys.objects o ON i.object_id = O.object_id
WHERE     s.database_id = DB_ID()
AND     OBJECTPROPERTY(s.[object_id], ''IsMsShipped'') = 0
AND     s.user_seeks = 0
AND     s.user_scans = 0
AND     s.user_lookups = 0
AND     i.name IS NOT NULL
ORDER BY s.user_updates DESC'

SELECT     TOP 20 *
FROM     #TempUnusedIndexes
ORDER BY [user_updates] DESC
DROP TABLE #TempUnusedIndexes
Logs and the index optimizer
If you find a business object with performance issues, you can get the SQL statement logic from the App Builder logs, then run it through an index optimizer utility to identify areas for improvement. To do this, follow these steps:
-
Navigate in the app to the page where the business object is being used.
-
Select IDE > Monitoring.
-
Click the Database Logs button.
-
Click the Edit Configuration button.
-
Click the Edit button.
-
Under Memory Log Configuration, set the Minimum Severity to Trace.
Important
Always reset this value back to Off when you are finished capturing log information.
-
Click the Save button, then close the dialog.
-
You should now be viewing the Fast Logs screen in App Builder, which consists of 500 lines of log data (unless you modify that 500 value). Scroll through the log data until you locate the SQL statement logic you're looking for.
-
Copy the entire SQL statement logic, starting with
SELECT. For example: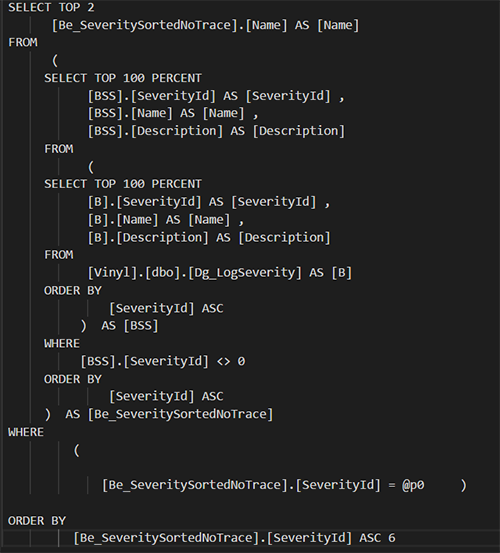
-
Click the Edit Configuration button.
-
Click Edit on the Log Configuration screen.
-
Under Memory Log Configuration, set the Minimum Severity to Off.
-
Launch SQL Server Management Studio.
-
Connect to your database connection.
-
There are a few different paths you can use in SQL Server Management Studio to ultimately better optimize some of the SQL statement logic your app is using.
-
You can click the New Query button, set the Available Database to the corresponding database for the app you're reviewing.
-
Enter the following query syntax, which is a query to find the Top 10 SQL queries that use the most resources (reads, writes, worker time (CPU), etc):

-
Click the Execute button.
-
Results will display the top 10 SQL queries that are taking the most amount of time to return information in your app. Note that the second entry in our example screenshot returns the same query we identified above (SELECT TOP 2…).

-
Click the New Query button from the toolbar.
-
Enter the SQL statement logic you copied from the App Builder logs.
-
Select the corresponding database from the Available Database select menu:

-
If you are using SQL Server database (SQL Express does not support this), you can right-click inside of the SQL Query panel and select Analyze Query in Database Engine Tuning Advisor. Here you can also use the execution plan utility, which will map out the execution path the SQL statement takes through the app database and helps pinpoint areas that may be taking significant time for tuning.
Database tuning is a complex and technical skill set, requires the right permissions to access and view database(s), and should be done methodically, carefully, and with rigorous testing done throughout the process to ensure the net result is positive.
Business object performance
Depending on how they are configured, business objects can cause App Builder app performance issues. This can happen for the following reasons:
-
The SQL logic contains a lot of subqueries.
-
The rule's logic contains unneeded columns.
-
The SQL contains
whereclauses that are not using index-friendly statements. -
There are missing indexes.
-
There are redundant indexes on tables being referenced by the SQL logic.
-
There are joins on calculated columns.
-
Index usage may be lost due to logic running through functions.
-
Check you have the right data type for columns. (For example,
INTinstead ofVARCHARfor numbers,TIMESTAMPinstead ofTEXTfor dates.) This can reduce storage size and improve query speed. -
A binary field is included when the field is not being used by a panel. You should only include binary fields in business objects if it's used as a file control. Also, you can consider creating business objects specifically to use on panels where a file is uploaded/downloaded.
-
All columns in a business object are loaded by App Builder for the following conditions:
-
Conditional formatting exists.
-
If a field has Supports Substitution enabled.
-
If a panel has any non-static visibility rules.
-
Business objects may still cause slow loading times with app pages, even if the business object results load quickly. Check to see if there are things on your app page impacting speed, such as sorting, list boxes, or other UI Layer settings that may cause slower page load times.
Flatten SQL queries
If you identify a specific business object that is causing performance issues, you may be able to improve the SQL logic and flatten the query with the following techniques:
-
Re-use subqueries where possible.
-
Consider reviewing and rewriting queries that have become overly complex or nested.
-
Examine execution plan and indexes.
Remove unused columns
Queries with performance issues may use columns in the SQL logic that are unnecessary. In such cases, you can do the following:
-
Reduce how much data subqueries are selecting. Remove these columns (especially calculated ones) to improve performance.
-
You can copy the rule and compare the performance of the copy with the original.
-
Measure the time for the first page of results to appear, and how long for each subsequent page of results.
Infrastructure optimization
Infrastructure optimization typically involves adding to or upgrading the hosts making up an App Builder environment. This section describes several methods for optimizing your infrastructure.
Horizontal scaling with load balancing
As the number of users grows, a single web server may not be able to handle the load. Horizontal scaling involves adding more web servers to process requests, and load balancers to distribute requests to web servers with the goal of maintaining an equal load across them.
This not only improves performance, but it also increases reliability, as traffic can be rerouted if a server fails.
Auto-scaling and load balancing are recommended for all cloud hosted environments.
Database scaling
The database server can be a performance bottleneck in high-traffic apps. Scaling the database helps to handle large amounts of data and query requests.
To handle read-heavy workloads, you can create read replicas, secondary database instances that contain a copy of the data from the primary database. You can configure your app to send all read-only queries to these replicas, leaving the primary database free to handle write operations, which require more resources.
For extremely large datasets that won't fit on a single server, you can consider the use of sharding, where a database is partitioned into smaller, more manageable pieces (shards) that are distributed across multiple servers. Each shard contains a unique subset of the data, allowing queries to run in parallel and dramatically increase capacity.
Caching layers
Caching is important, but dedicated caching layers can provide a more robust solution. For production (HC) or production (HCHA) system profiles, you should use a dedicated in-memory caching system like Redis or Memcached. These systems store data in RAM, providing faster retrieval times. Your app first checks the cache for data, and only queries the database if the data is not found. This can help reduce the load on the database server.
Resource allocation and monitoring
To ensure the hosts comprising your App Builder environments are correctly sized and specified, you should actively monitor their performance.
You should try to provision your servers with enough CPU, RAM, and fast storage (such as SSDs) to handle your expected workload. Vertical scaling (upgrading to more powerful hardware) can be a temporary solution before horizontal scaling becomes necessary.
Monitoring tools help you to track key metrics such as CPU usage, memory consumption, disk I/O, and network traffic. These metrics can help you identify performance bottlenecks before they impact users.