Marimekko chart in Jitterbit App Builder
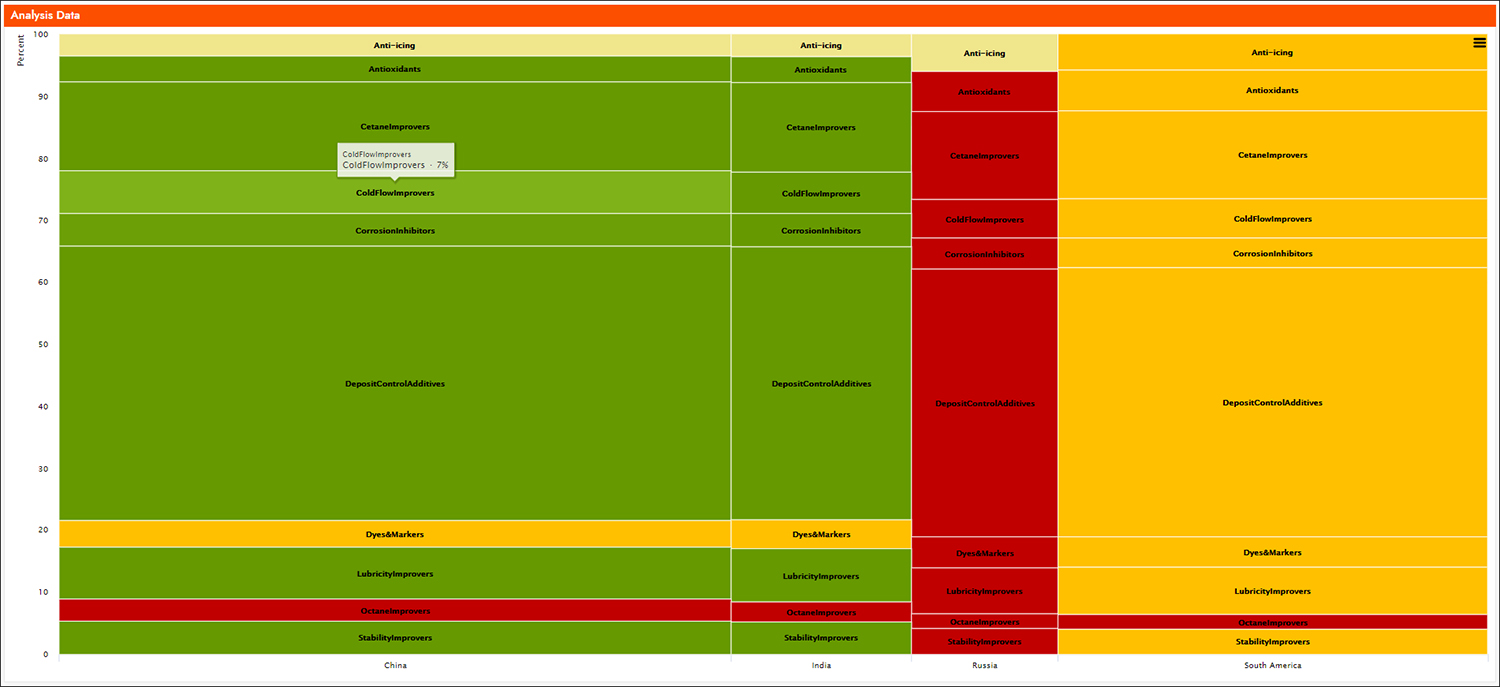
The Marimekko Chart type is a two dimensional stacked chart. In addition to the varying segment heights of a standard stacked chart, a Marimekko chart also has varying column widths. Column widths are scaled so that the total width matches the desired chart width. Marimekko Charts are often used to analyze market and sales data.

To configure a marimekko chart
To create a Marimekko Chart, you'll need an associated Business Object that contains the underlying data you want to display on the chart.
Required information in the Business Object:
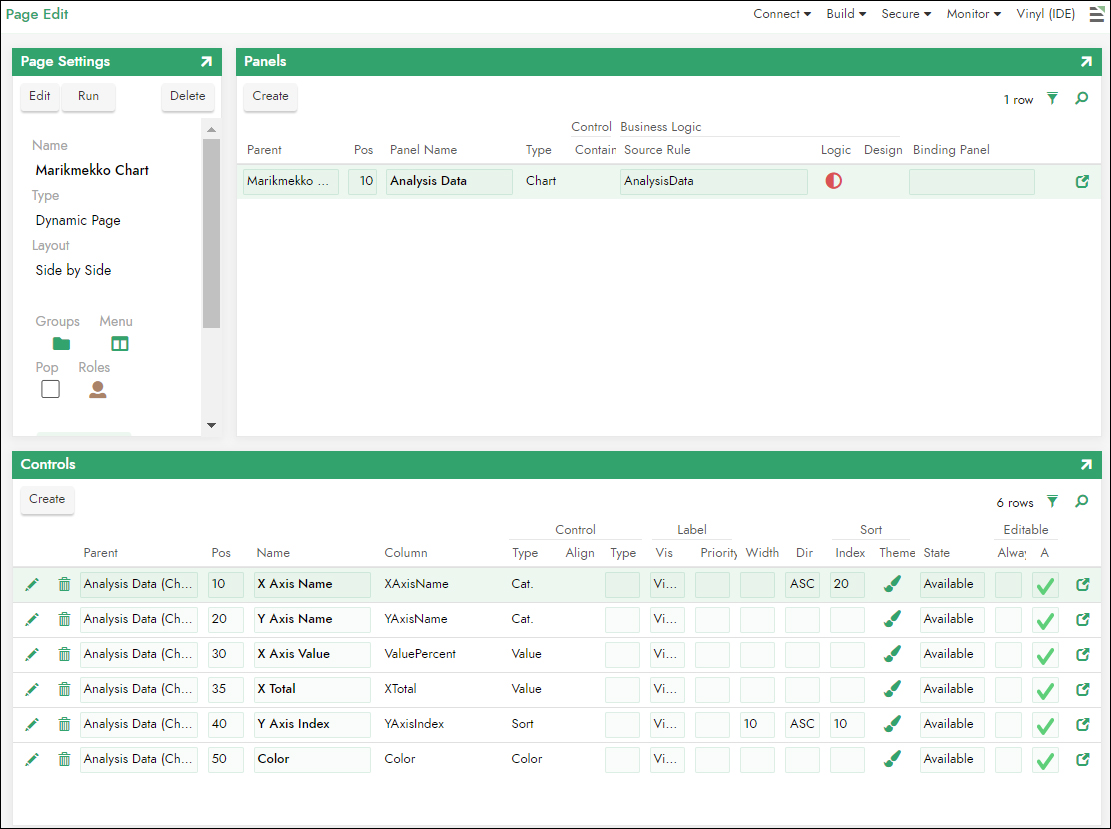
- Category values defined for X Axis Name and Y Axis Name
- Value values defined for X Axis Value and X Axis Total
Note
The X Axis Value should represent a value percentage where for each column on the Markimekko chart this combined value should total 100.
Optional information:
- Sort Control to provide sorting. For example: X Axis Index
- Color Control to provide specific color instructions
Once you have the Business Object defined:
- Navigate to the page where you want to add the Marimekko and go to the Action Drawer > Design this page
- Click Create in Panels
- Select Chart as the Type
- Select Marimekko as Chart Type
- Select the Business Object created as the Source Rule. For example: Analysis Data
- Click Save
- Exit out of Panel Data Options
- Click Create under Controls
-
Define the required Controls for the Chart (Category for X and Y Axis and Value for X Axis and X Axis Total)

-
Click Run under Page Settings and confirm the chart draws as expected
