IDE Monitoring page in Jitterbit App Builder
The Monitoring page provides tools to monitor the state of your applications. It can be found in the IDE, under the Runtime section.
It is divided into four tabs, described in detail below:
Services tab
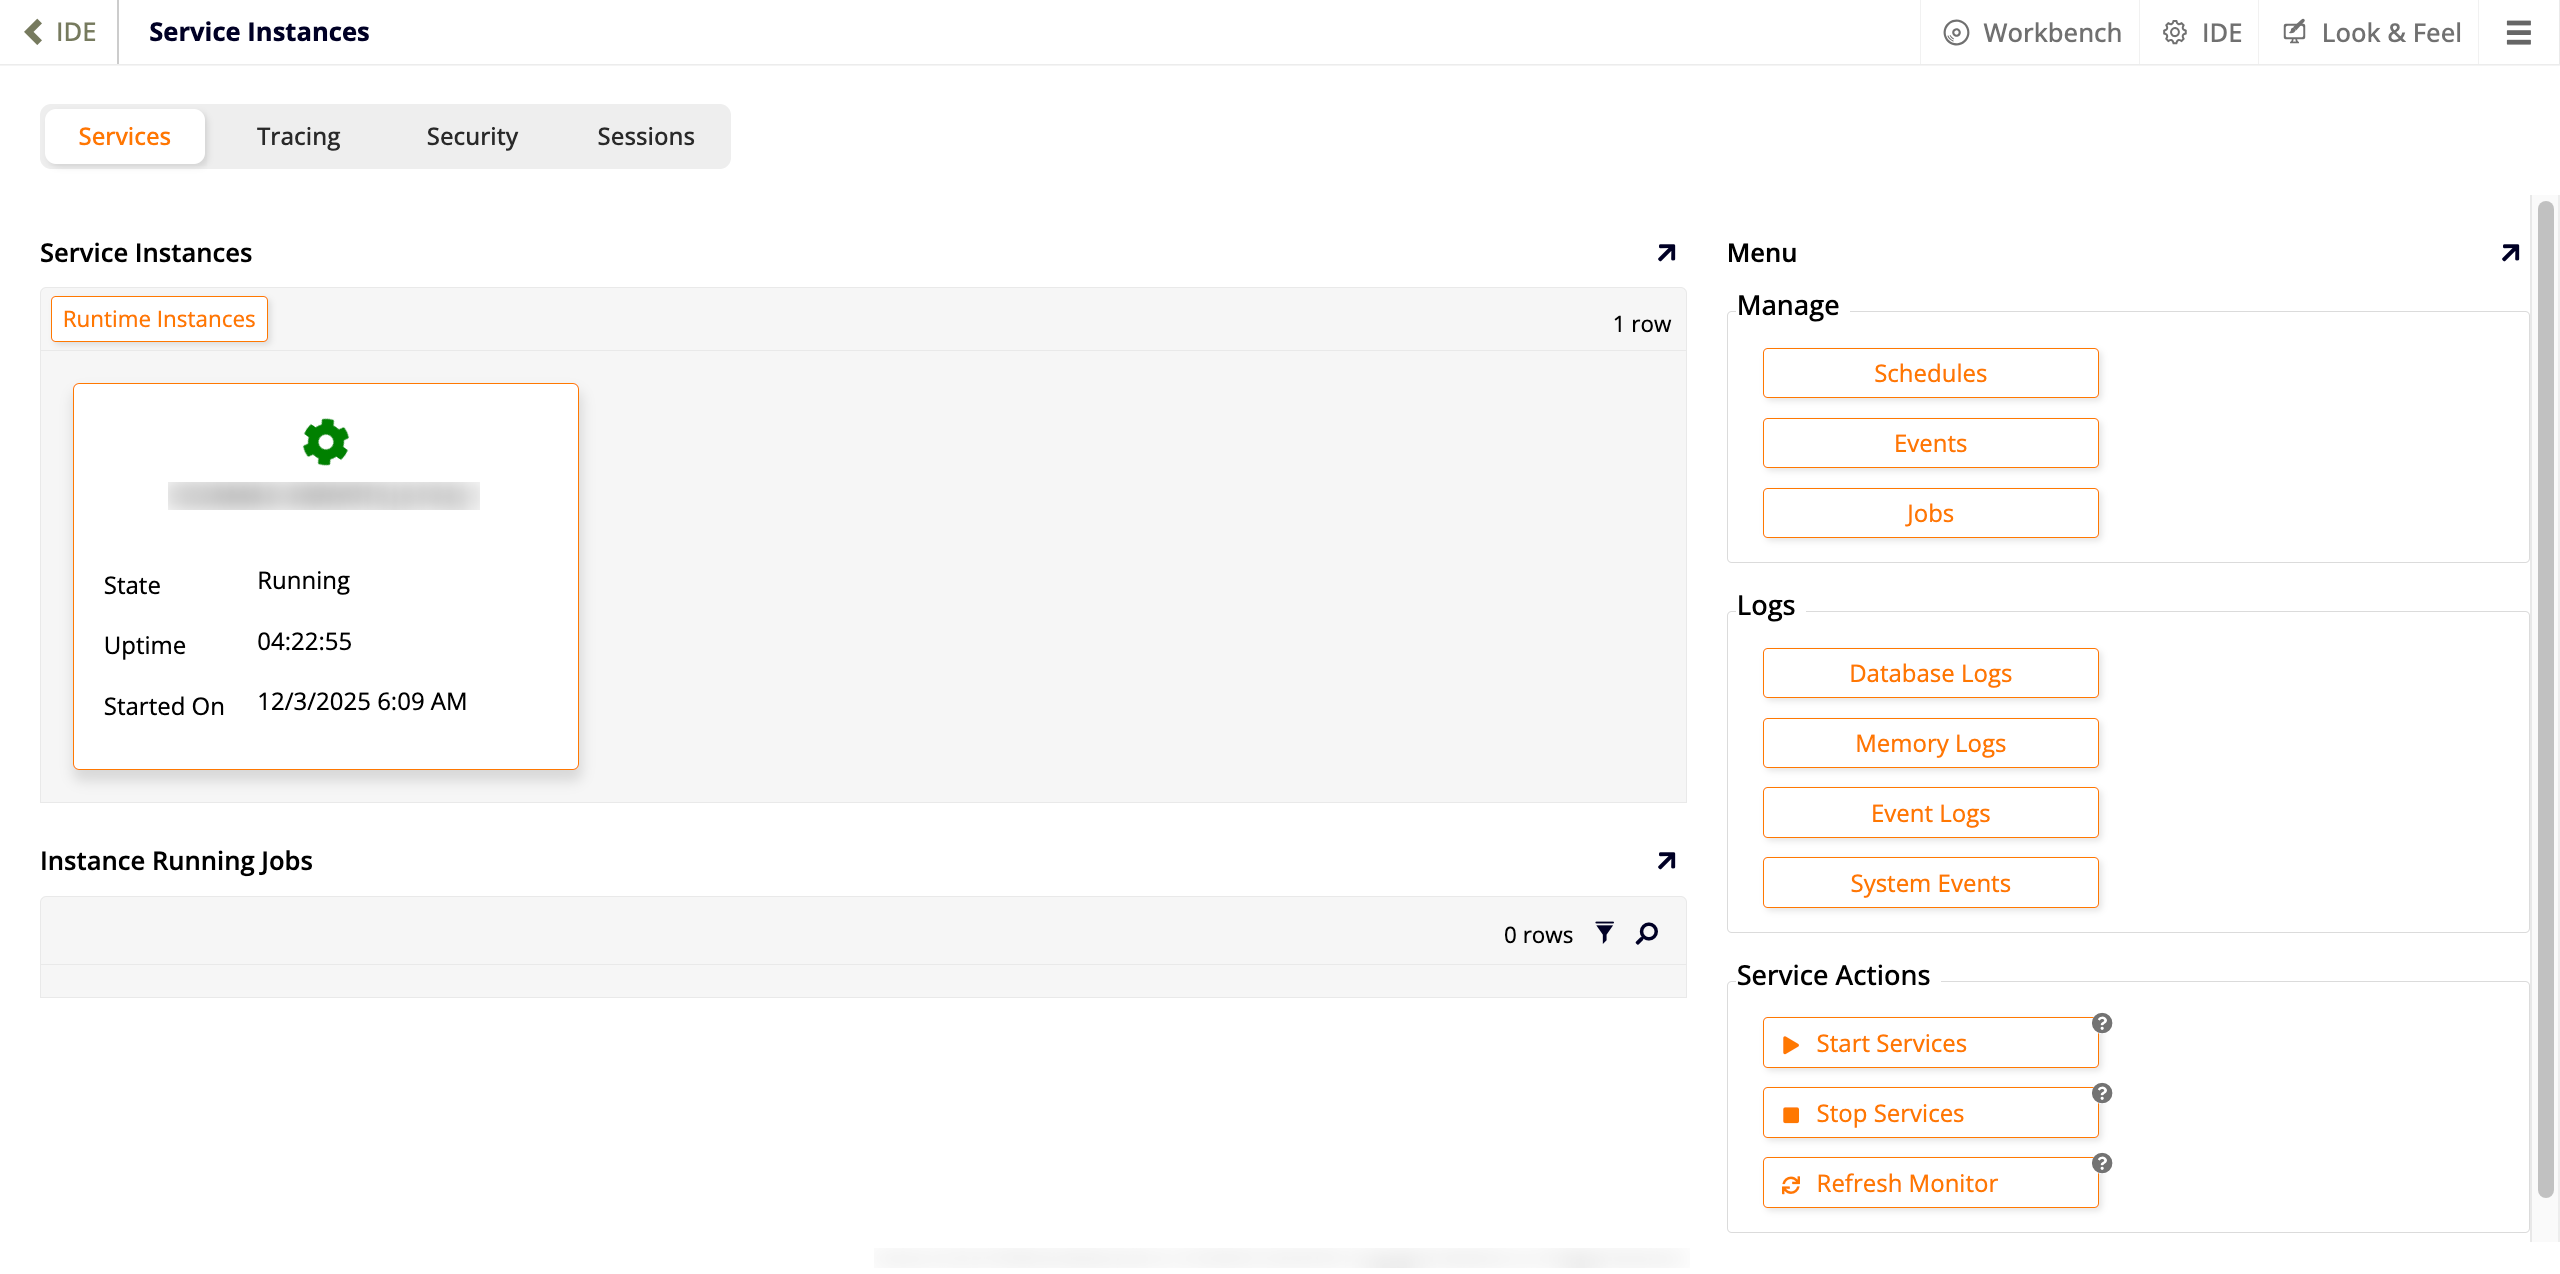
The Services tab contains information about App Builder's background services, the feature that allows long-running events to run in a throttled background queue. There are three panels in this tab:
-
Service Instances
Shows which service instances are currently active. -
Instance Running Jobs
Shows which instances are currently running jobs and their status. -
Menu
Divided into three sections:-
Manage
-
Logs
-
Database Logs: Read the database logs.
-
Memory Logs: Read the memory logs.
-
Event Logs: Read the event logs.
-
System Events: A complete log of system events.
-
-
Service Actions
-
Start Services: Click to restart the service, clear the activity table and begin scheduling and support of background event.
-
Stop Services: Let currently executing jobs finish, and cancel any exiting queued jobs. This also prevents any scheduled or invoked events from being queued.
-
Refresh Monitor: Load the latest information for the running service instances and jobs, avoiding the need to refresh the entire browser.
-
-
Tracing
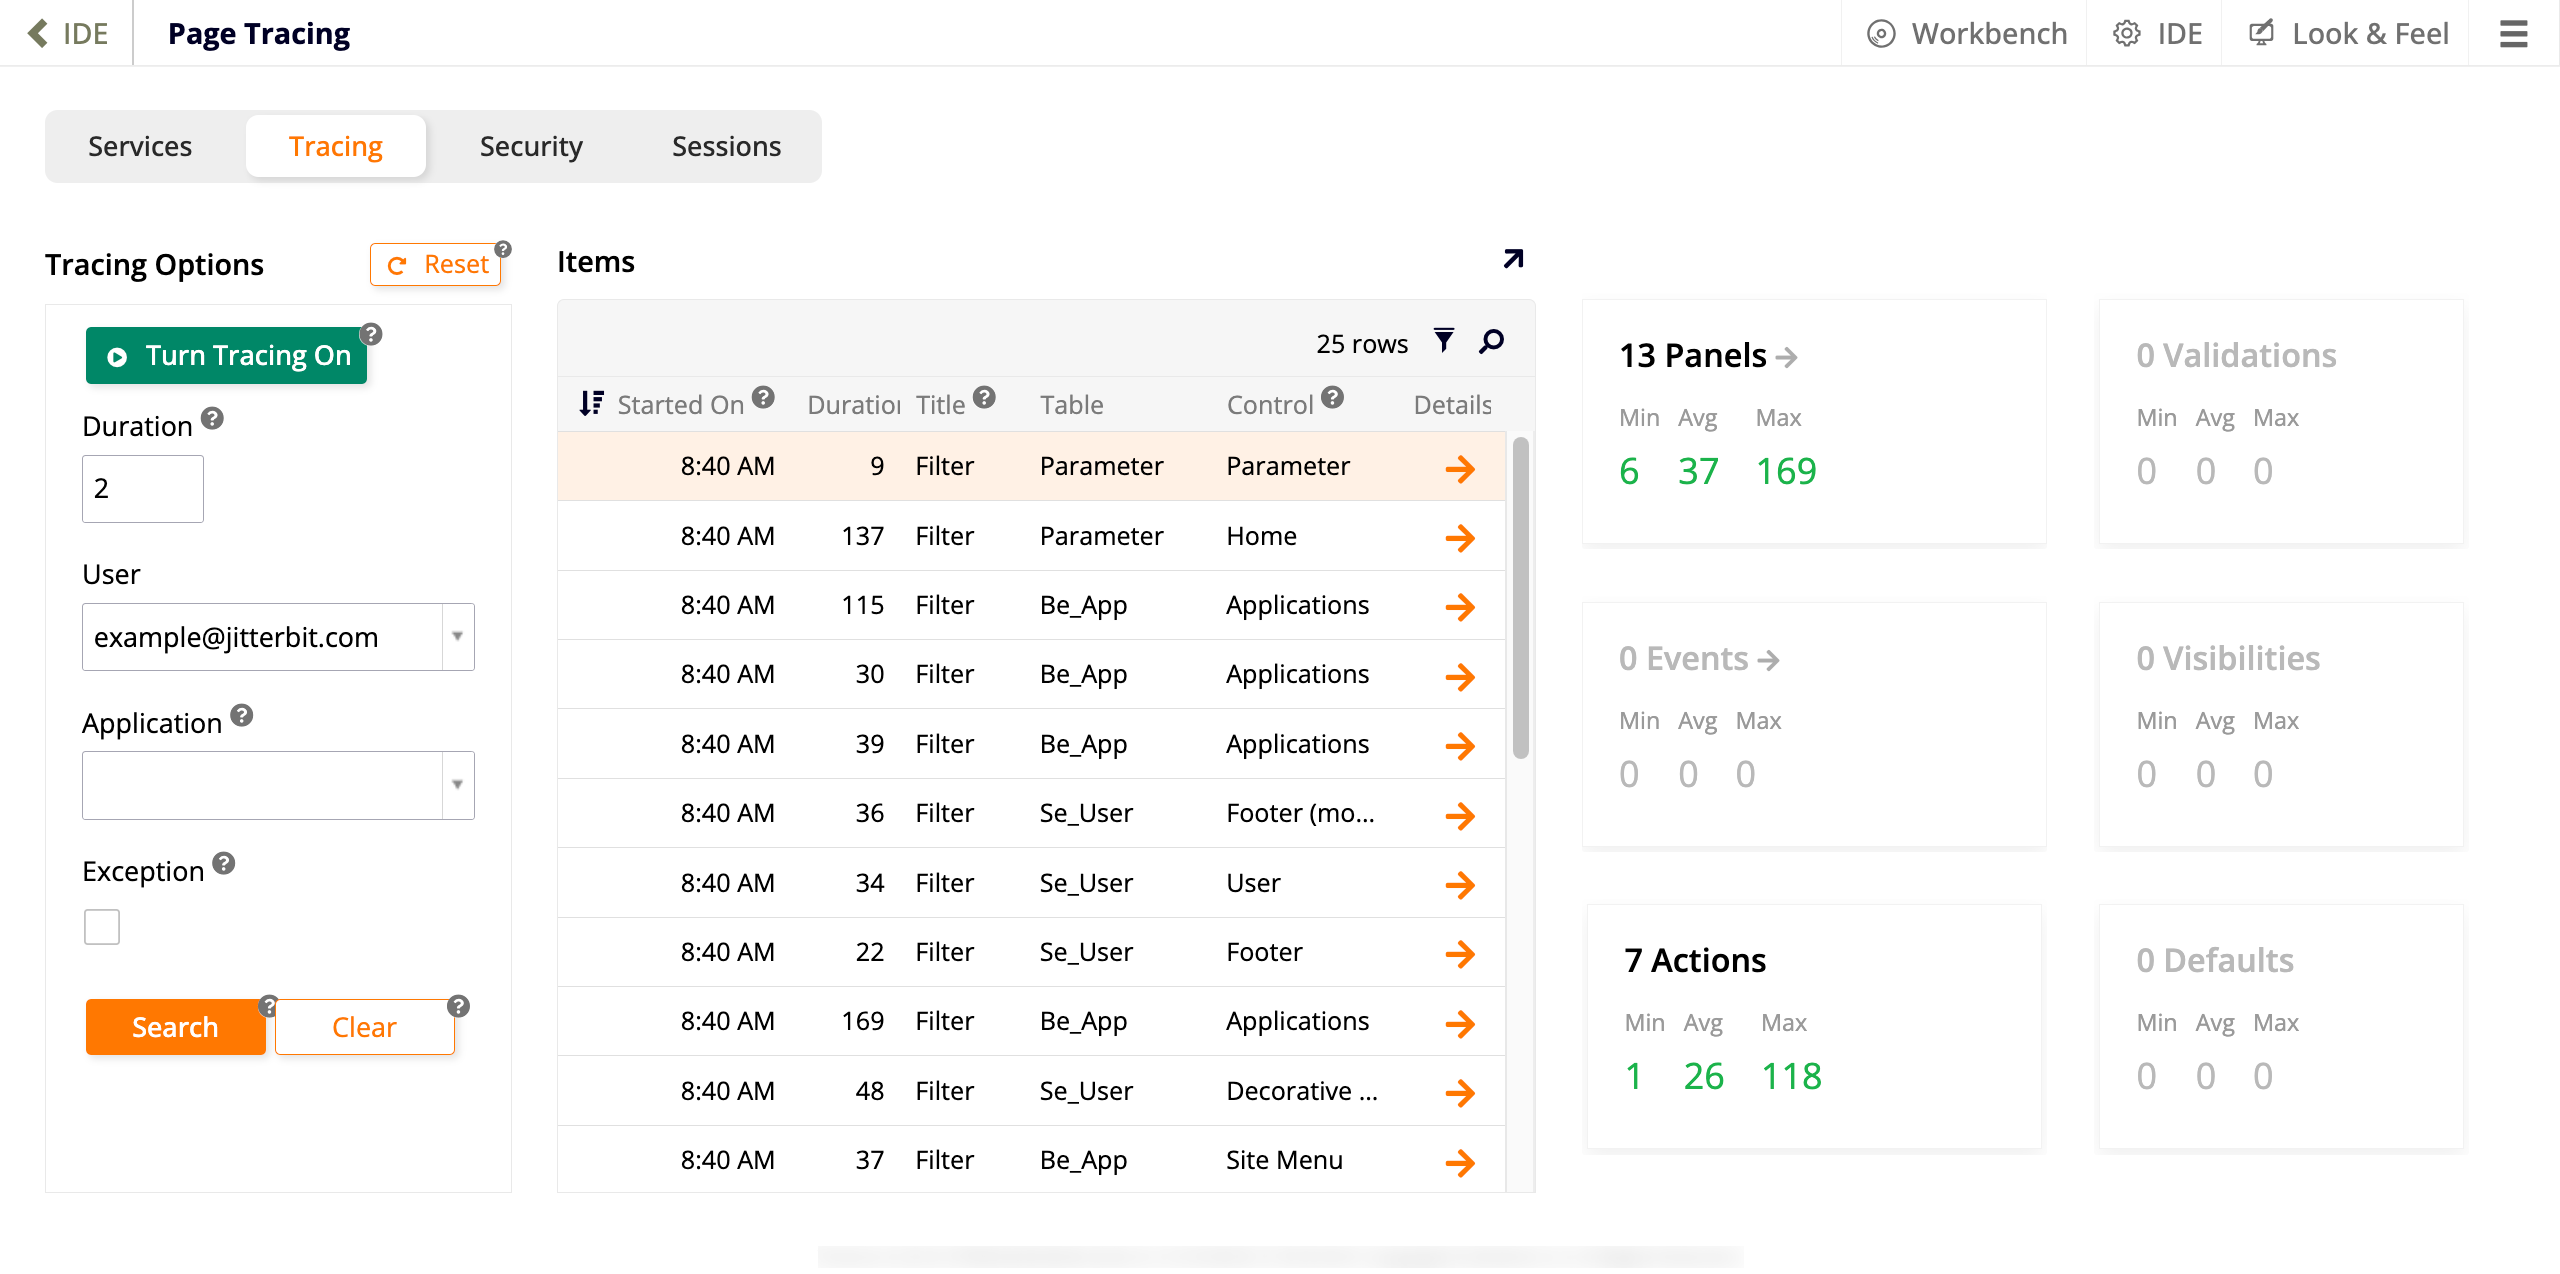
The Tracing tab allows you to enable, disable and see the results generated by the tracing feature, a diagnostic feature used to troubleshoot applications. There are two panels in this tab:
-
Tracing Options
Use the options in this panel to set up tracing and configure how it should work.-
Reset: Delete the current tracing records for the current user. This button only appears when there are results being shown.
-
Turn Tracing On: Click to turn tracing on for the current user. This button changes to Turn Tracing Off once the feature is enabled.
-
Duration: Enter the number of minutes that tracing remains enabled once started. If empty, tracing is automatically disabled after one hour.
-
User: Select which user to enable tracing for.
-
Application: Filter the tracing results by application.
-
Exception: Select this checkbox to show only items that have thrown an exception.
-
Search: Search based on filter criteria.
-
Clear: Clear the search criteria.
-
-
Items
This panel contains:-
A table listing all the actions performed by a user while tracing was enabled for them. Each row of the table has a Details button that can be clicked to reveal more information.
-
Metric results that you can click on and drill down to see which one is the slowest. The metrics are split into Min (minimum), Avg (average), and Max (maximum) and are color-coded as follows:
-
Green: Durations of less than one second.
-
Yellow: Durations between one and two seconds.
-
Red: Durations more than two seconds.
-
-
Security
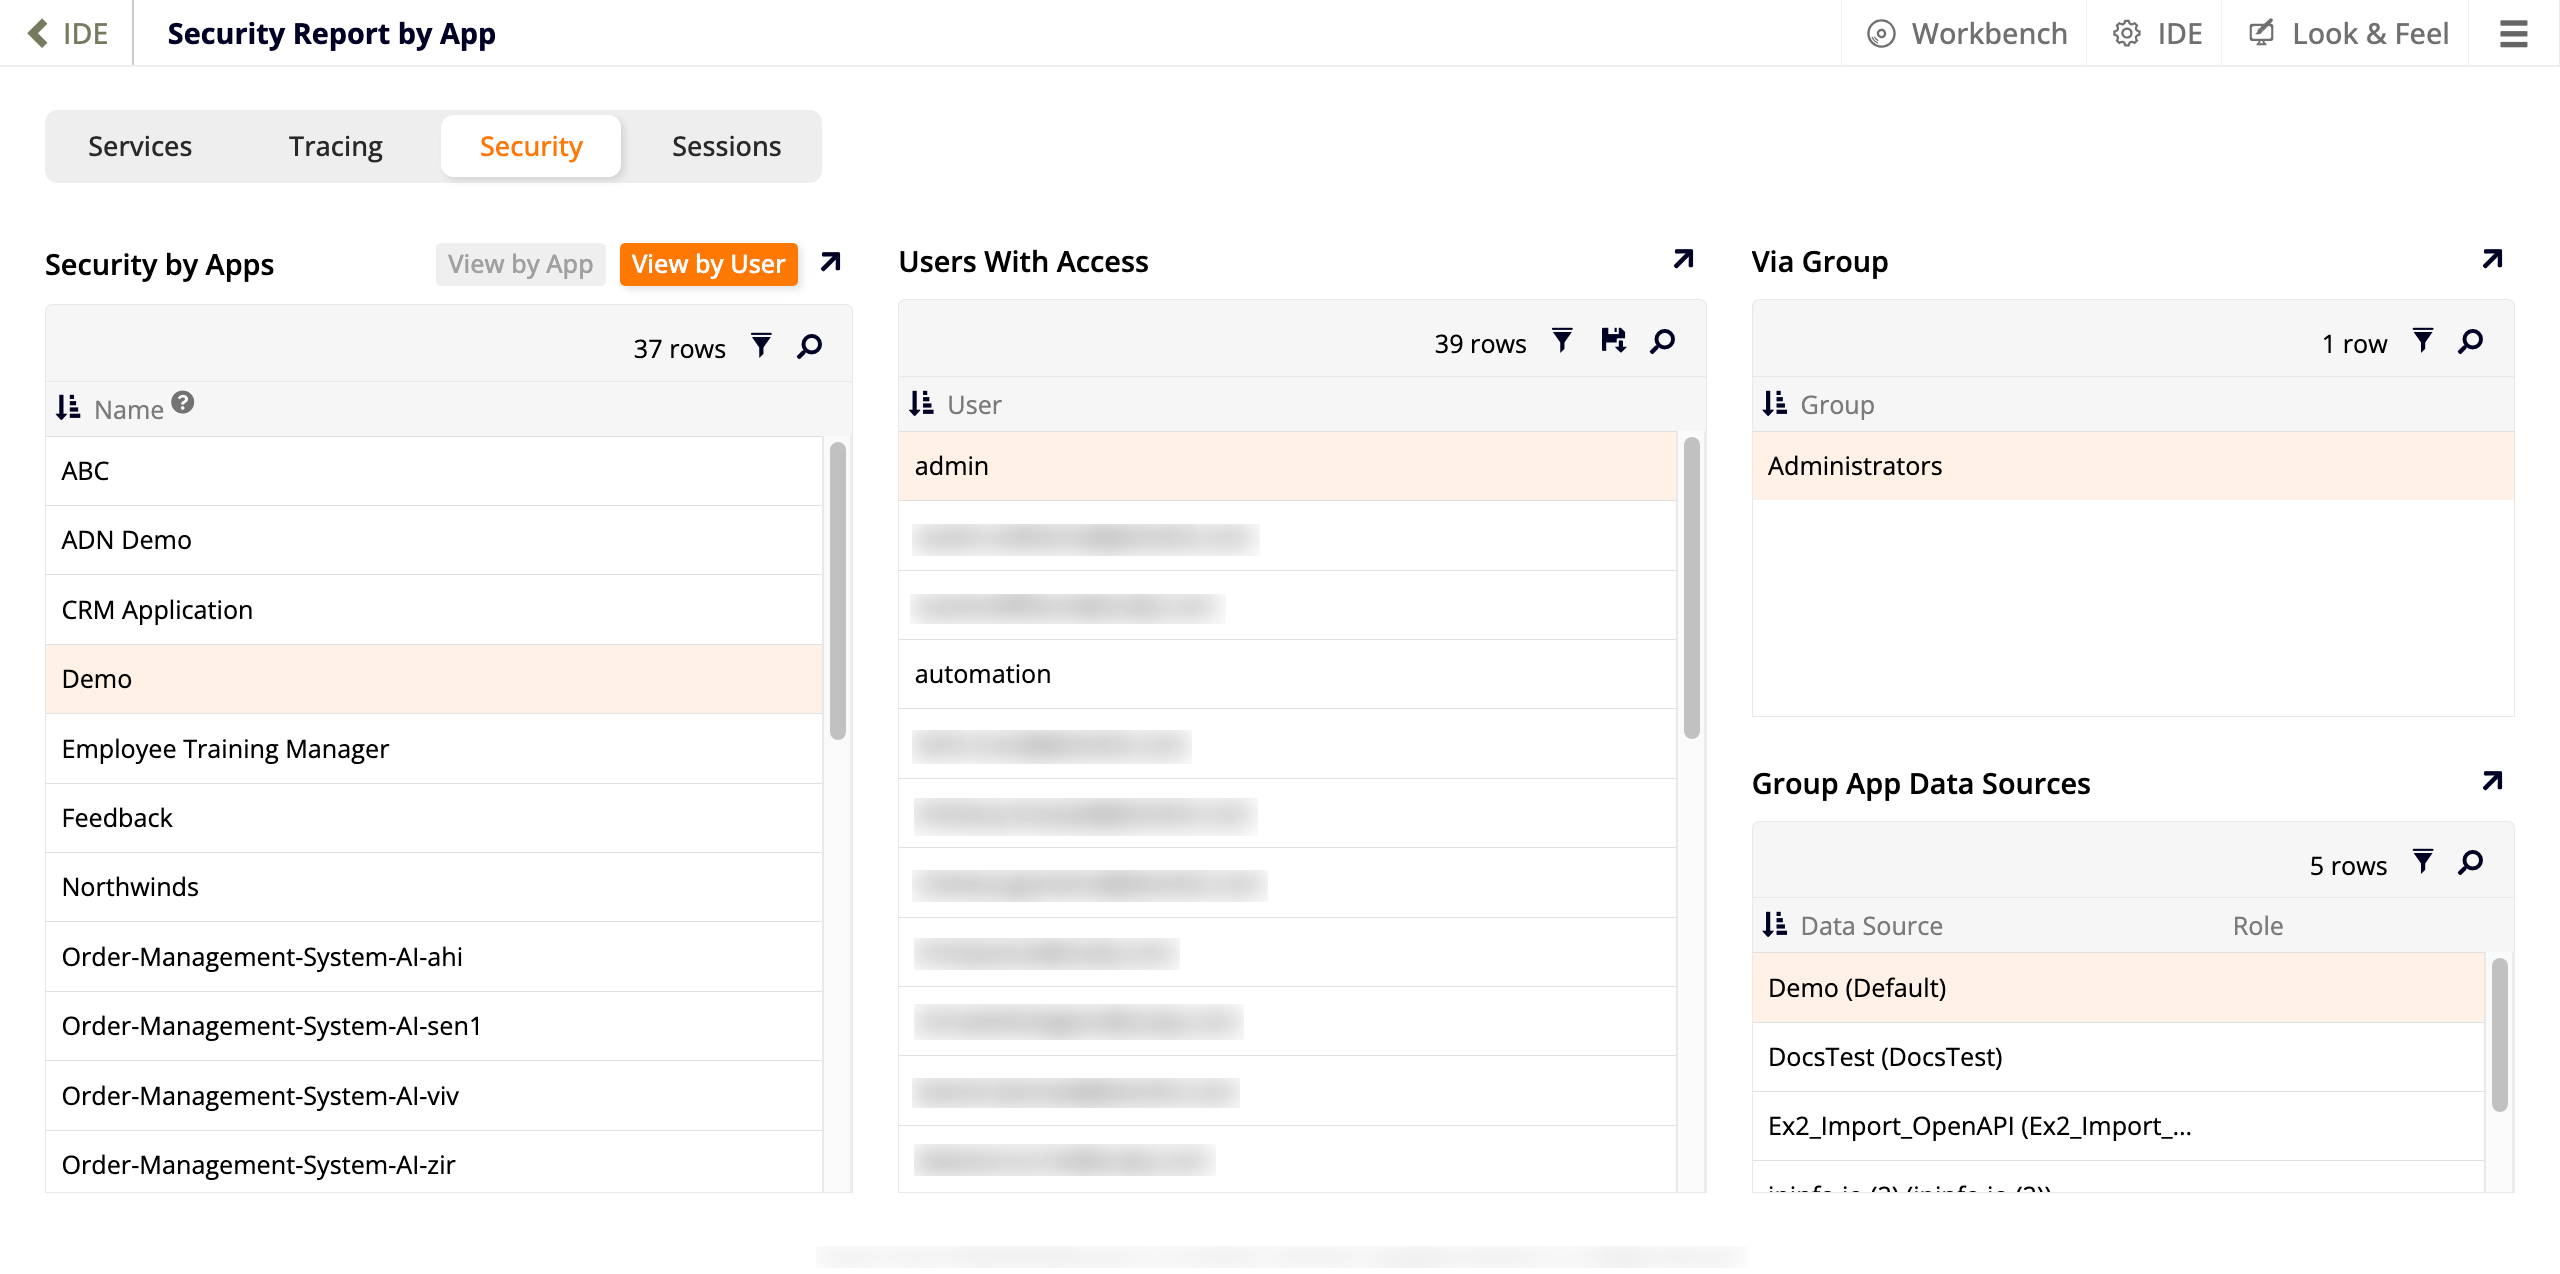
The Security tab summarizes information about the users and groups that have access to the applications present in that environment. There are two ways of viewing the information on this page:
-
View by App (default)
When selected, the first panel on the page lists all apps present in the environment. Selecting one row determines the content of the other three panels: Users With Access lists all users that can access the selected app, Via Group shows which group or groups give the selected user access to the app, and Group App Data Sources lists the data sources that the selected group has access to. -
View by User
When selected, the first panel on the page lists all users that have access to at least one app in the environment. Selecting one row determines the content of the other three panels: Applications lists all users that the selected user can access, Via Group shows which group or groups give the selected user access to the app or apps, and Group App Data Sources lists the data sources that the selected group has access to.
Sessions
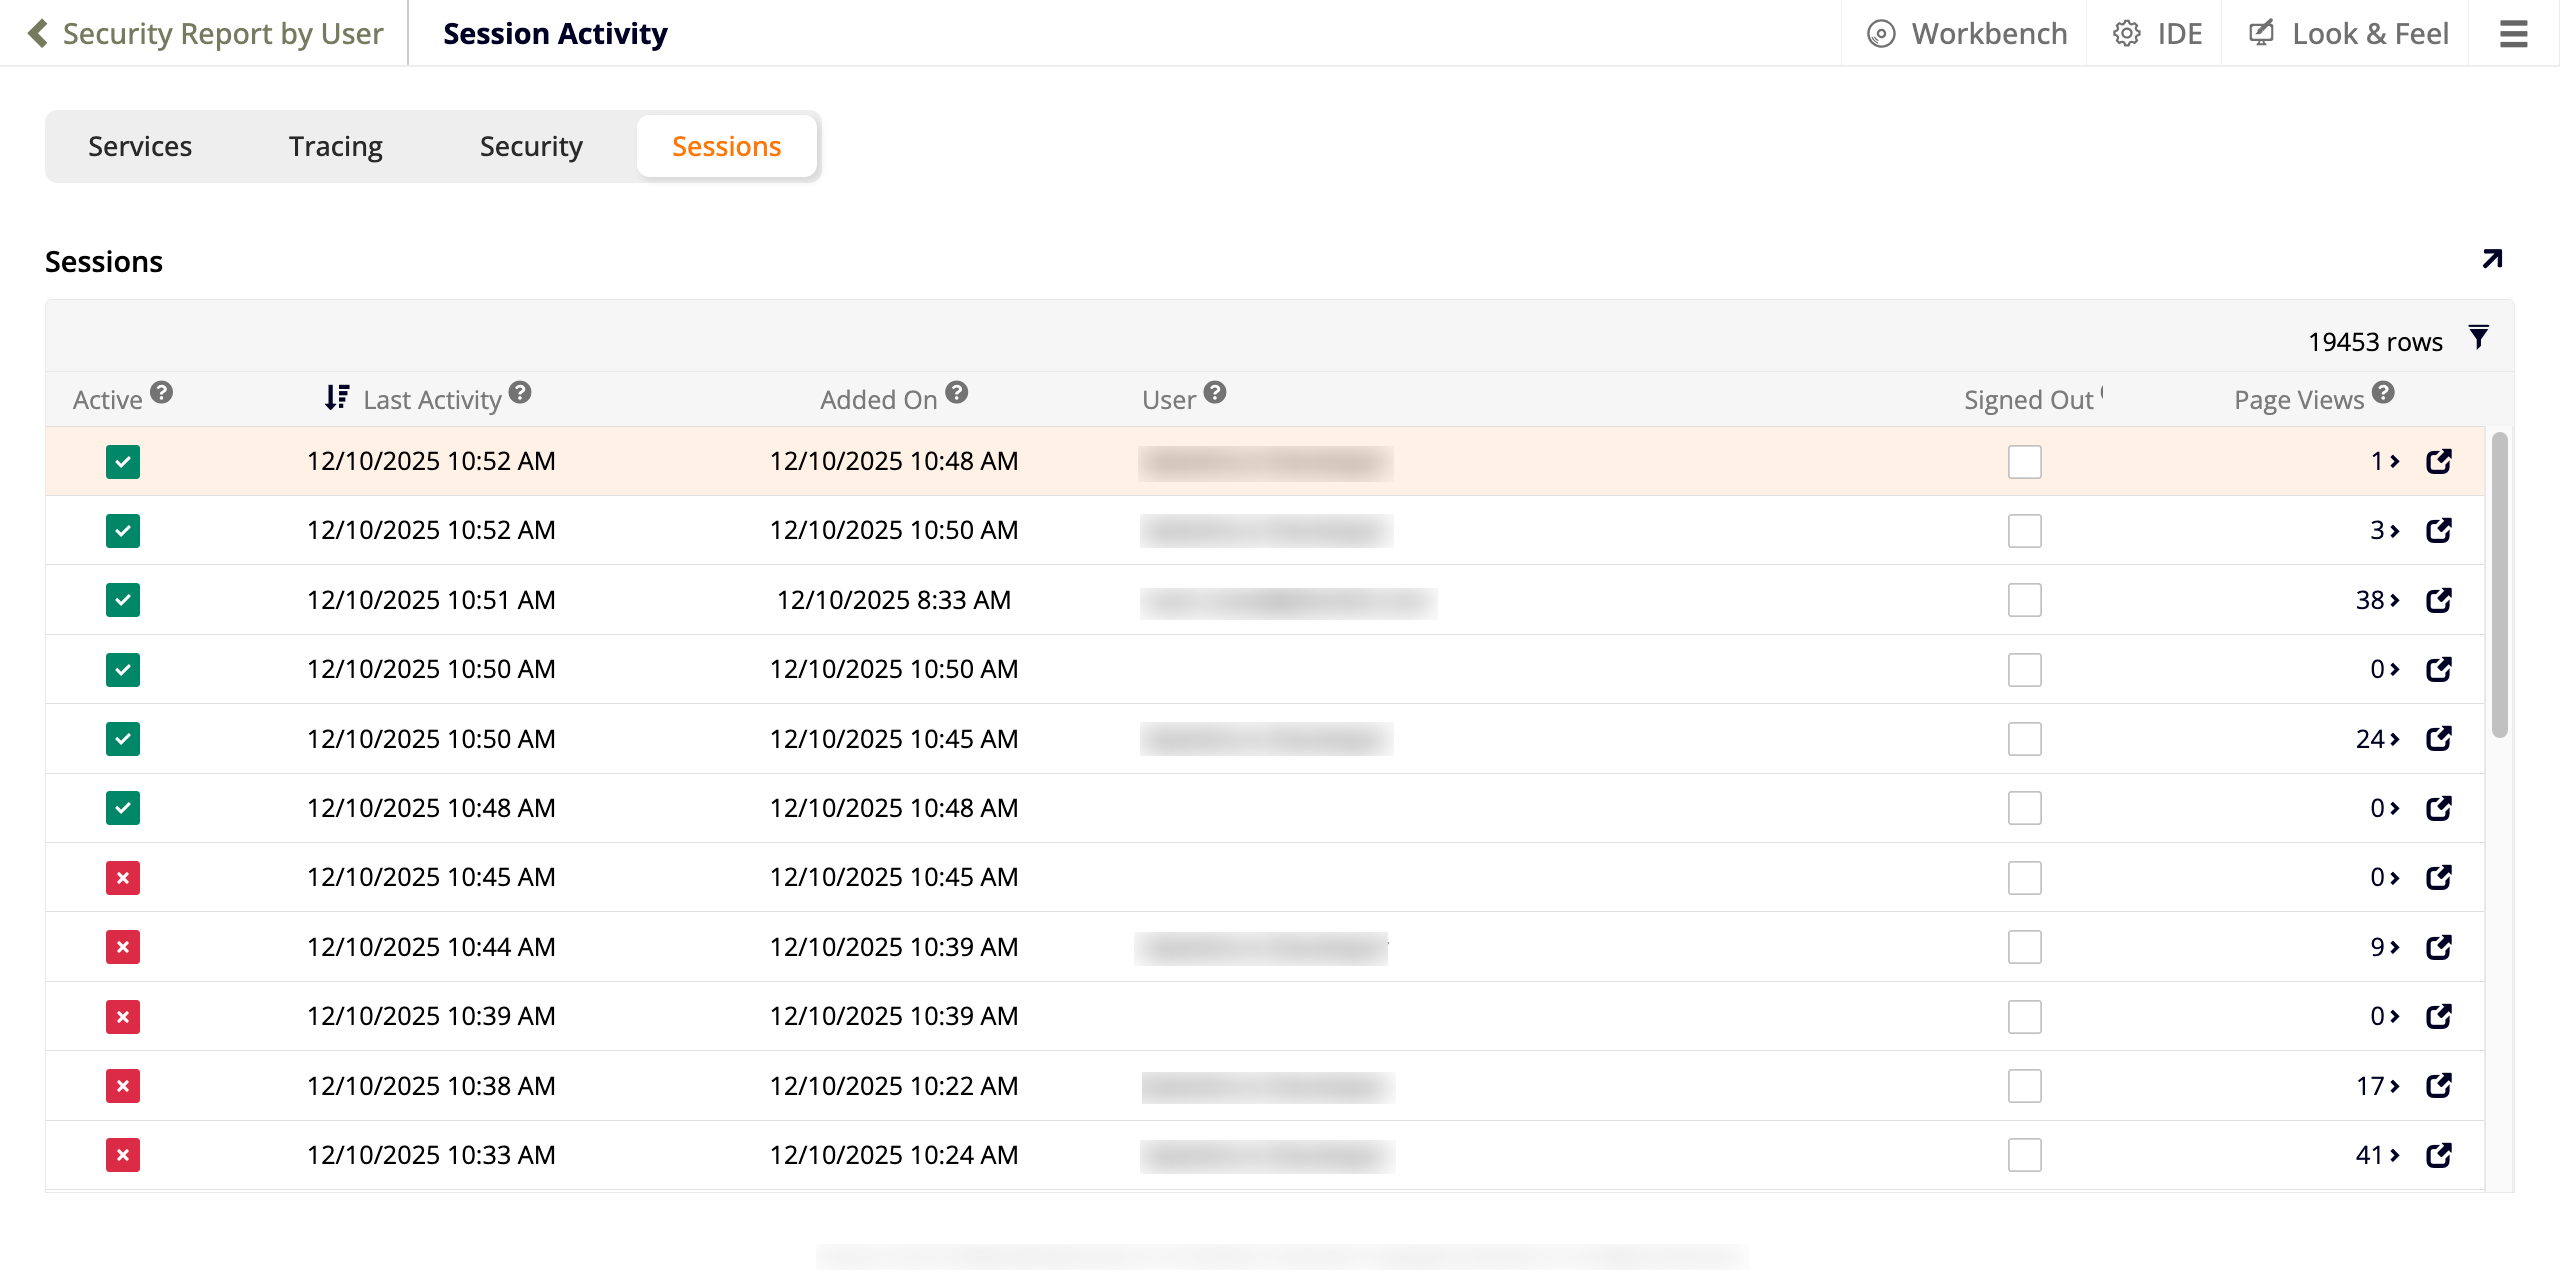
This tab shows a complete list of recent sessions, showing:
-
Active: Whether the session has recent activity.
-
Last Activity: The most recent activity.
-
Added On: The date and time that the session was created.
-
User: Who logged in.
-
Signed Out: Whether the user has signed out.
-
Page Views: How many pages that user has seen in their session.
-
Click the Open record icon to reveal further details, including authentication and client information such as language, device, browser, etc.