Dashboard options and best practices in Jitterbit App Builder
App Builder offers several types of Dashboard options for use when building out an app, depending on your specific business requirement(s). Dashboards allow you to visualize the Key Performance Indicators and other strategic data for your organization at a quick glance. A compelling Dashboard design distills large volumes of data into concise, meaningful, and actionable visualizations. This guide will present different Dashboard options available in App Builder as well as some best practice information for working with Dashboards in apps.
Collection of panels and/or charts
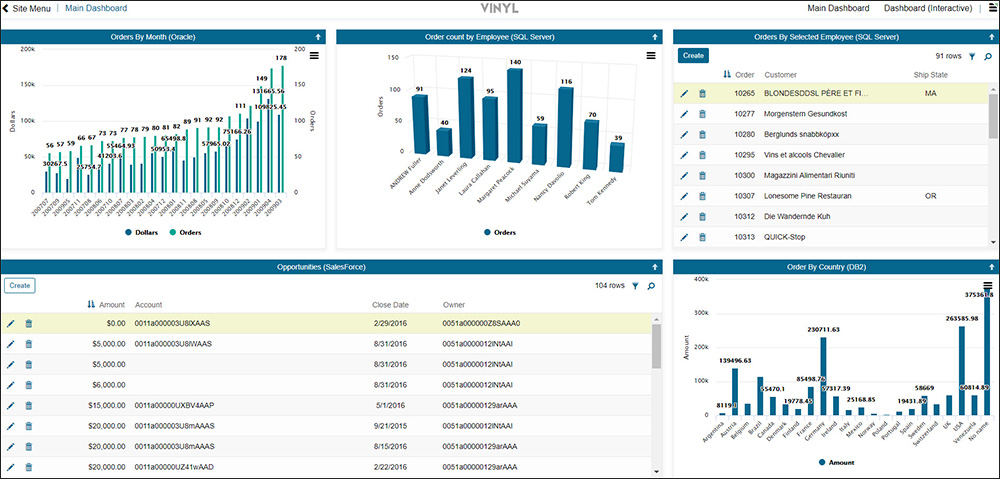
One way to design Dashboards in App Builder is by using a collection of different Panel types. Typically Dashboards are developed using combinations of Form or Grid panels and/or Chart Panel(s). With this approach, each panel can have a different data source. Each panel displayed in the Dashboard can have a different Theme applied, if desired.
In the Dashboard example shown below, there is a collection of two Chart Panels and one Grid panel. The Pie Chart on the left illustrates a dynamic chart that is bound to the information presented on the Line Chart in the top right panel, these charts are bound by Employee ID.

Collection of Charts and an MRP Panel Dashboard Example
In the Dashboard example shown next, we leverage a collection of three different Charts as well as two Multi-Row Panels:

Collection of Charts and Grid panels Dashboard Example
Tile panels
Another way Dashboards can be developed is by using Tile panels (rather than Chart panels or other type panels like Form and Grid) to hold and display the Key Performance Indicator data. Depending on your business requirement(s), Tile panels can offer you greater flexibility with the graphic display of the data than other panel types. Tile panels are essentially defined content containers displayed in a grid style layout on the application page.
With Tile panels, each cell is the same data source and display the same type of data. Conditional formatting can be used with Tile panels (and other panel types) to change colors based on specified criteria, which is very helpful to the User viewing the Dashboard.

Tile panels Dashboard example with Conditional Formatting to change panel Header color
Widgets
Widgets can optionally be used when developing a Dashboard in App Builder. Widgets allow developers to use controls in the UI Layer which aren't natively available through App Builder itself. Depending on your business requirement(s) for your Dashboard, using Widgets may help you present the data in a graphically engaging manner.
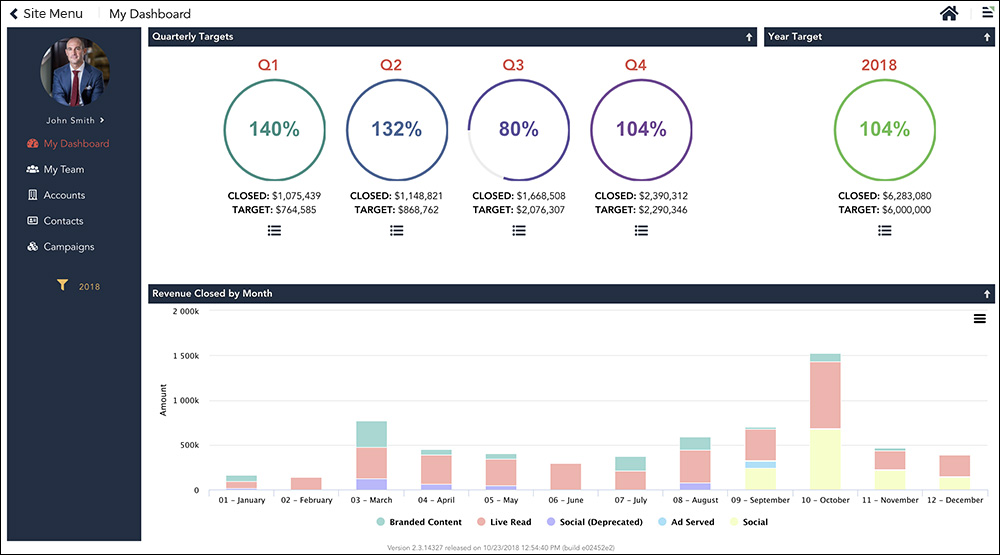
As an example, if you are looking to display data on Quarterly and Year Targets in your Dashboard you might consider using a Dial/Knob Widget vs. a type of Chart (e.g., Bar Chart). Here's a screenshot of how this might look:

Widget Dashboard example using the Dial/Knob Widget for Quarterly and Year Target Panels
For more information on working with Widgets in App Builder, see Widgets.
Optional metrics table
An option when developing Dashboards in App Builder is to use a Metrics table. With this approach, you create and use a Metrics table within your App Builder app to store the data being presented in the Dashboard view. Business Logic Rules are also created with this approach, to instruct App Builder on the specific data being stored within the Metrics table. This option is useful if rendering some of the Dashboard metrics are too slow to render. With this approach you can use a background job to fetch and store values in the Metrics Table.
The Dashboard example shown next uses a Metric table that has been created in the App Builder app to store the data presented on the Dashboard. The Metric table stores information on the different data points being displayed on the Dashboard.
The Metric table gets data fed to it from various CRUD Business Rules that were created to instruct App Builder on what data to store. For example, you might have a series of CRUD Rules that insert counts of records on different tables that are being displayed in the Dashboard. In this particular example we have CRUD Update Rules configured that insert counts of records into the Metrics table from the Customer, Supplier, Order, Employee, Product and Shipper tables.