Conversation Dashboard in Jitterbit App Builder
Overview
The Conversation Dashboard is a page for reviewing and debugging conversations between your users and a Conversational AI agent. It captures each conversation's messages, along with metadata such as message duration and, for each response from the agent, the full request and response exchanged with the agent's API endpoint.
Access the Conversation Dashboard
Select IDE > Runtime > AI Conversations. The Conversation Dashboard opens:
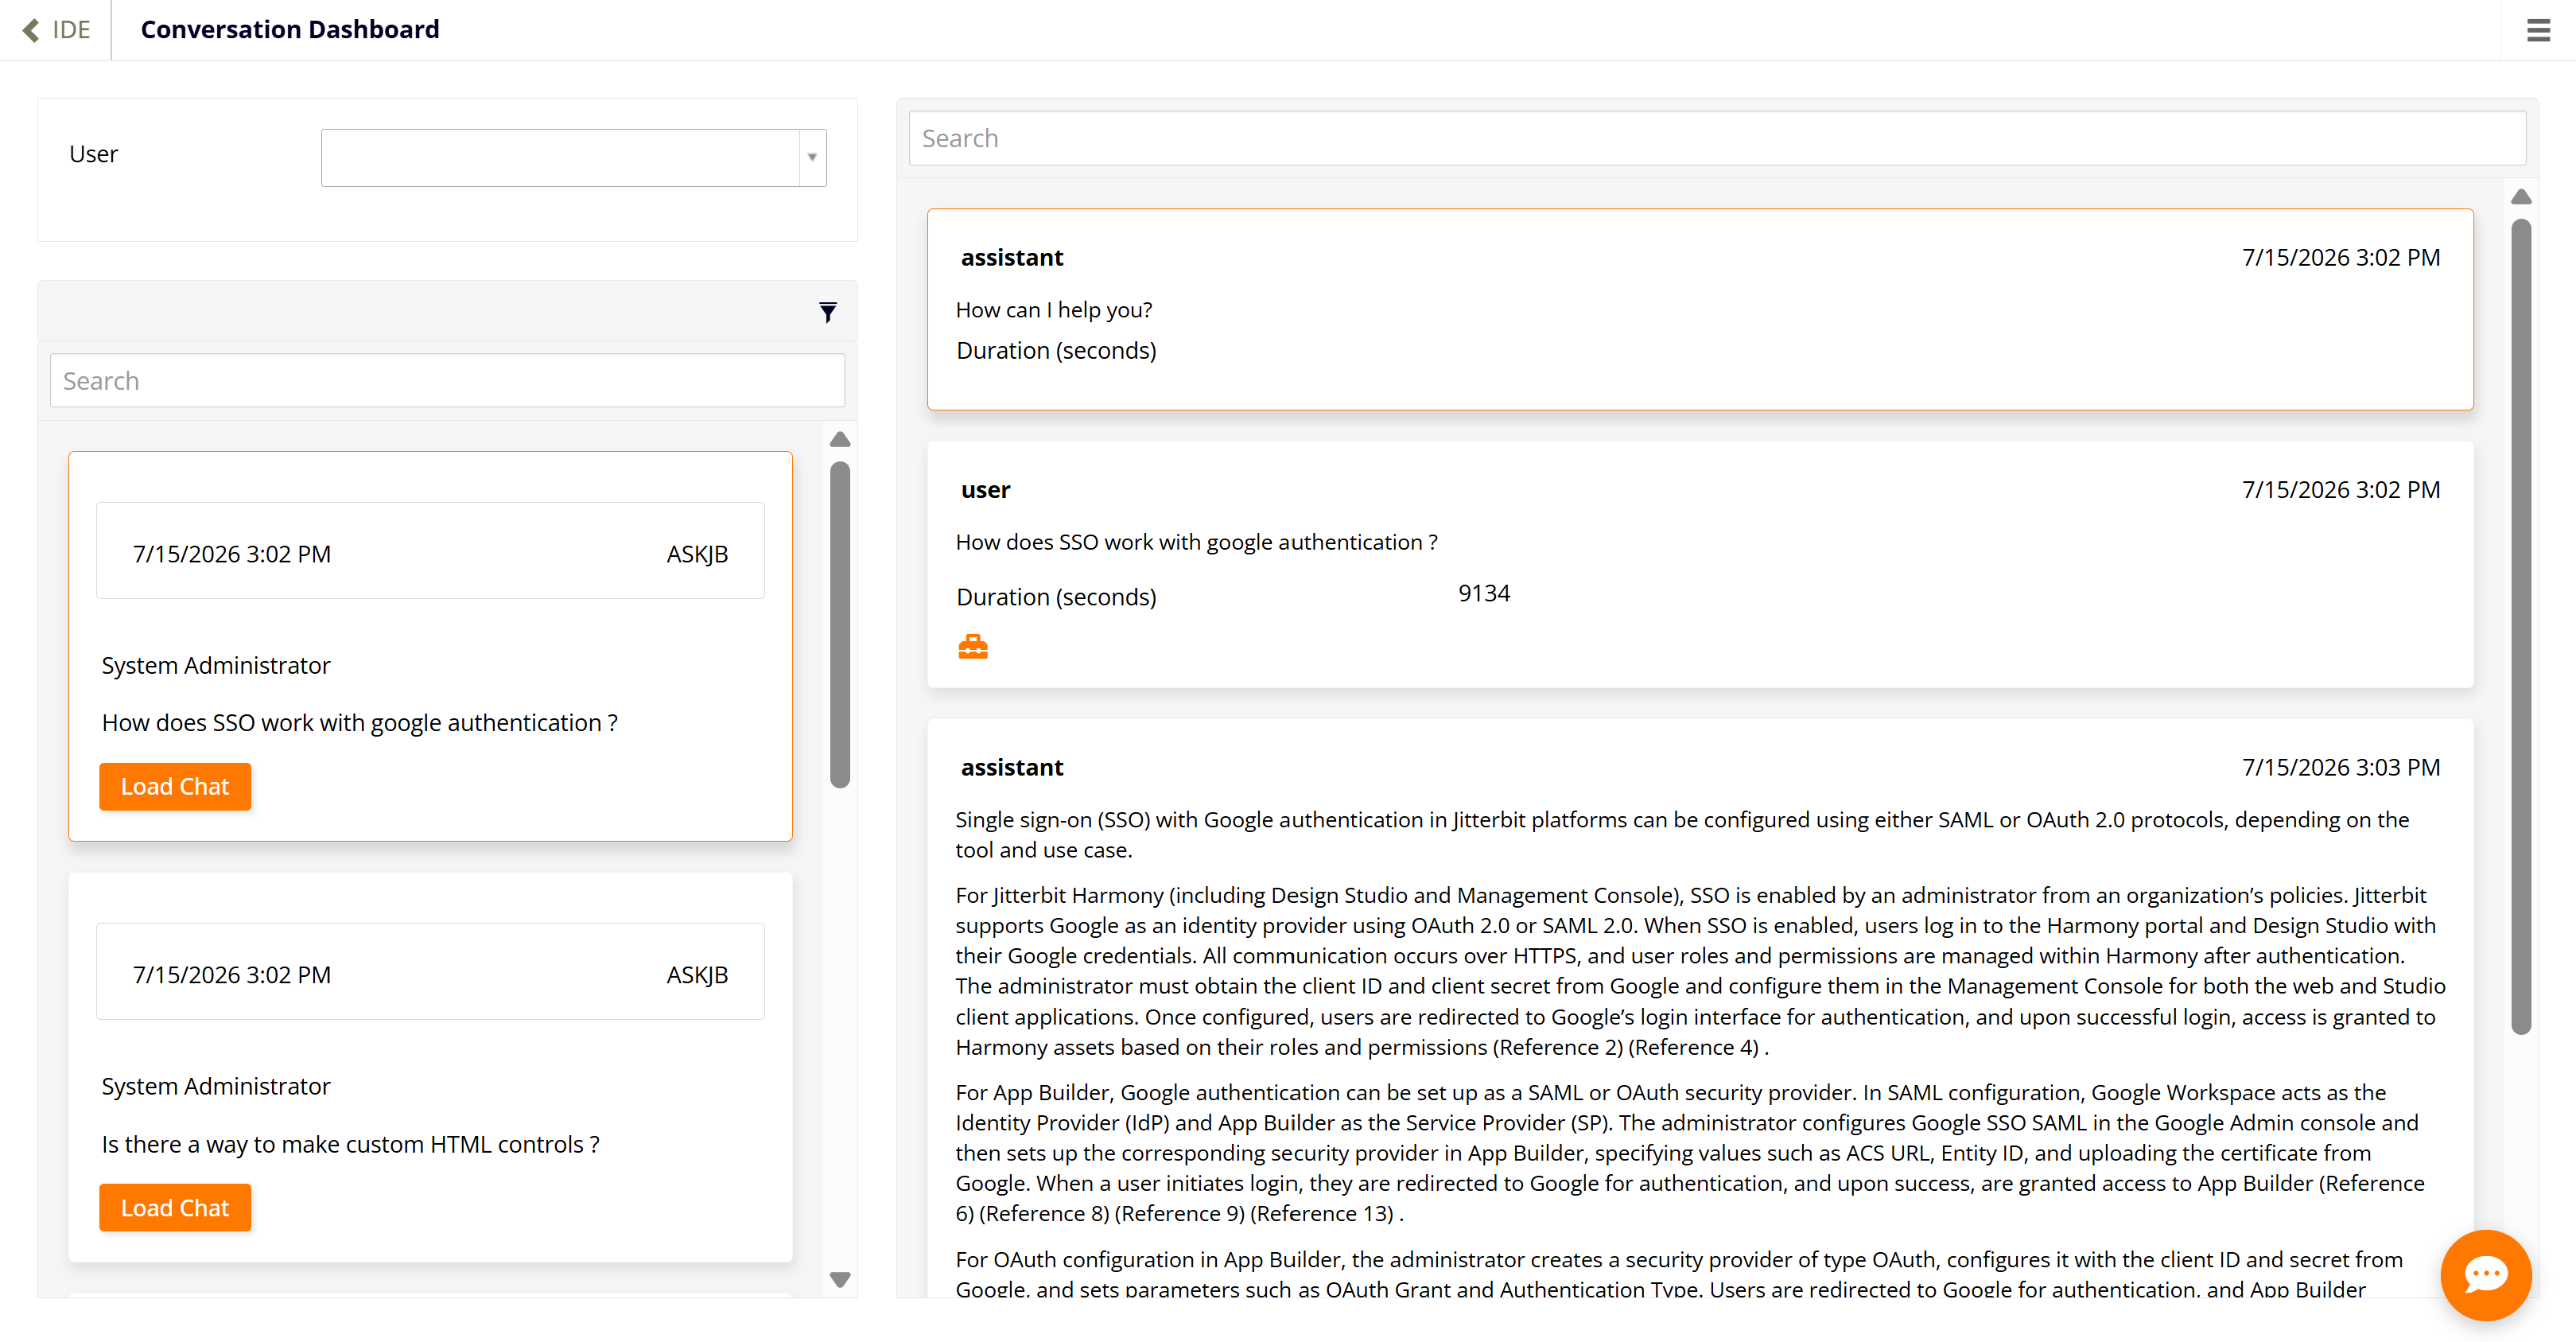
The dashboard has two panels:
-
The left panel lists conversations. Use the User field to filter by user, and the search bar to search conversations.
-
The right panel shows the messages for the selected conversation. Each message includes its role (user or assistant), timestamp, content, and duration in seconds.
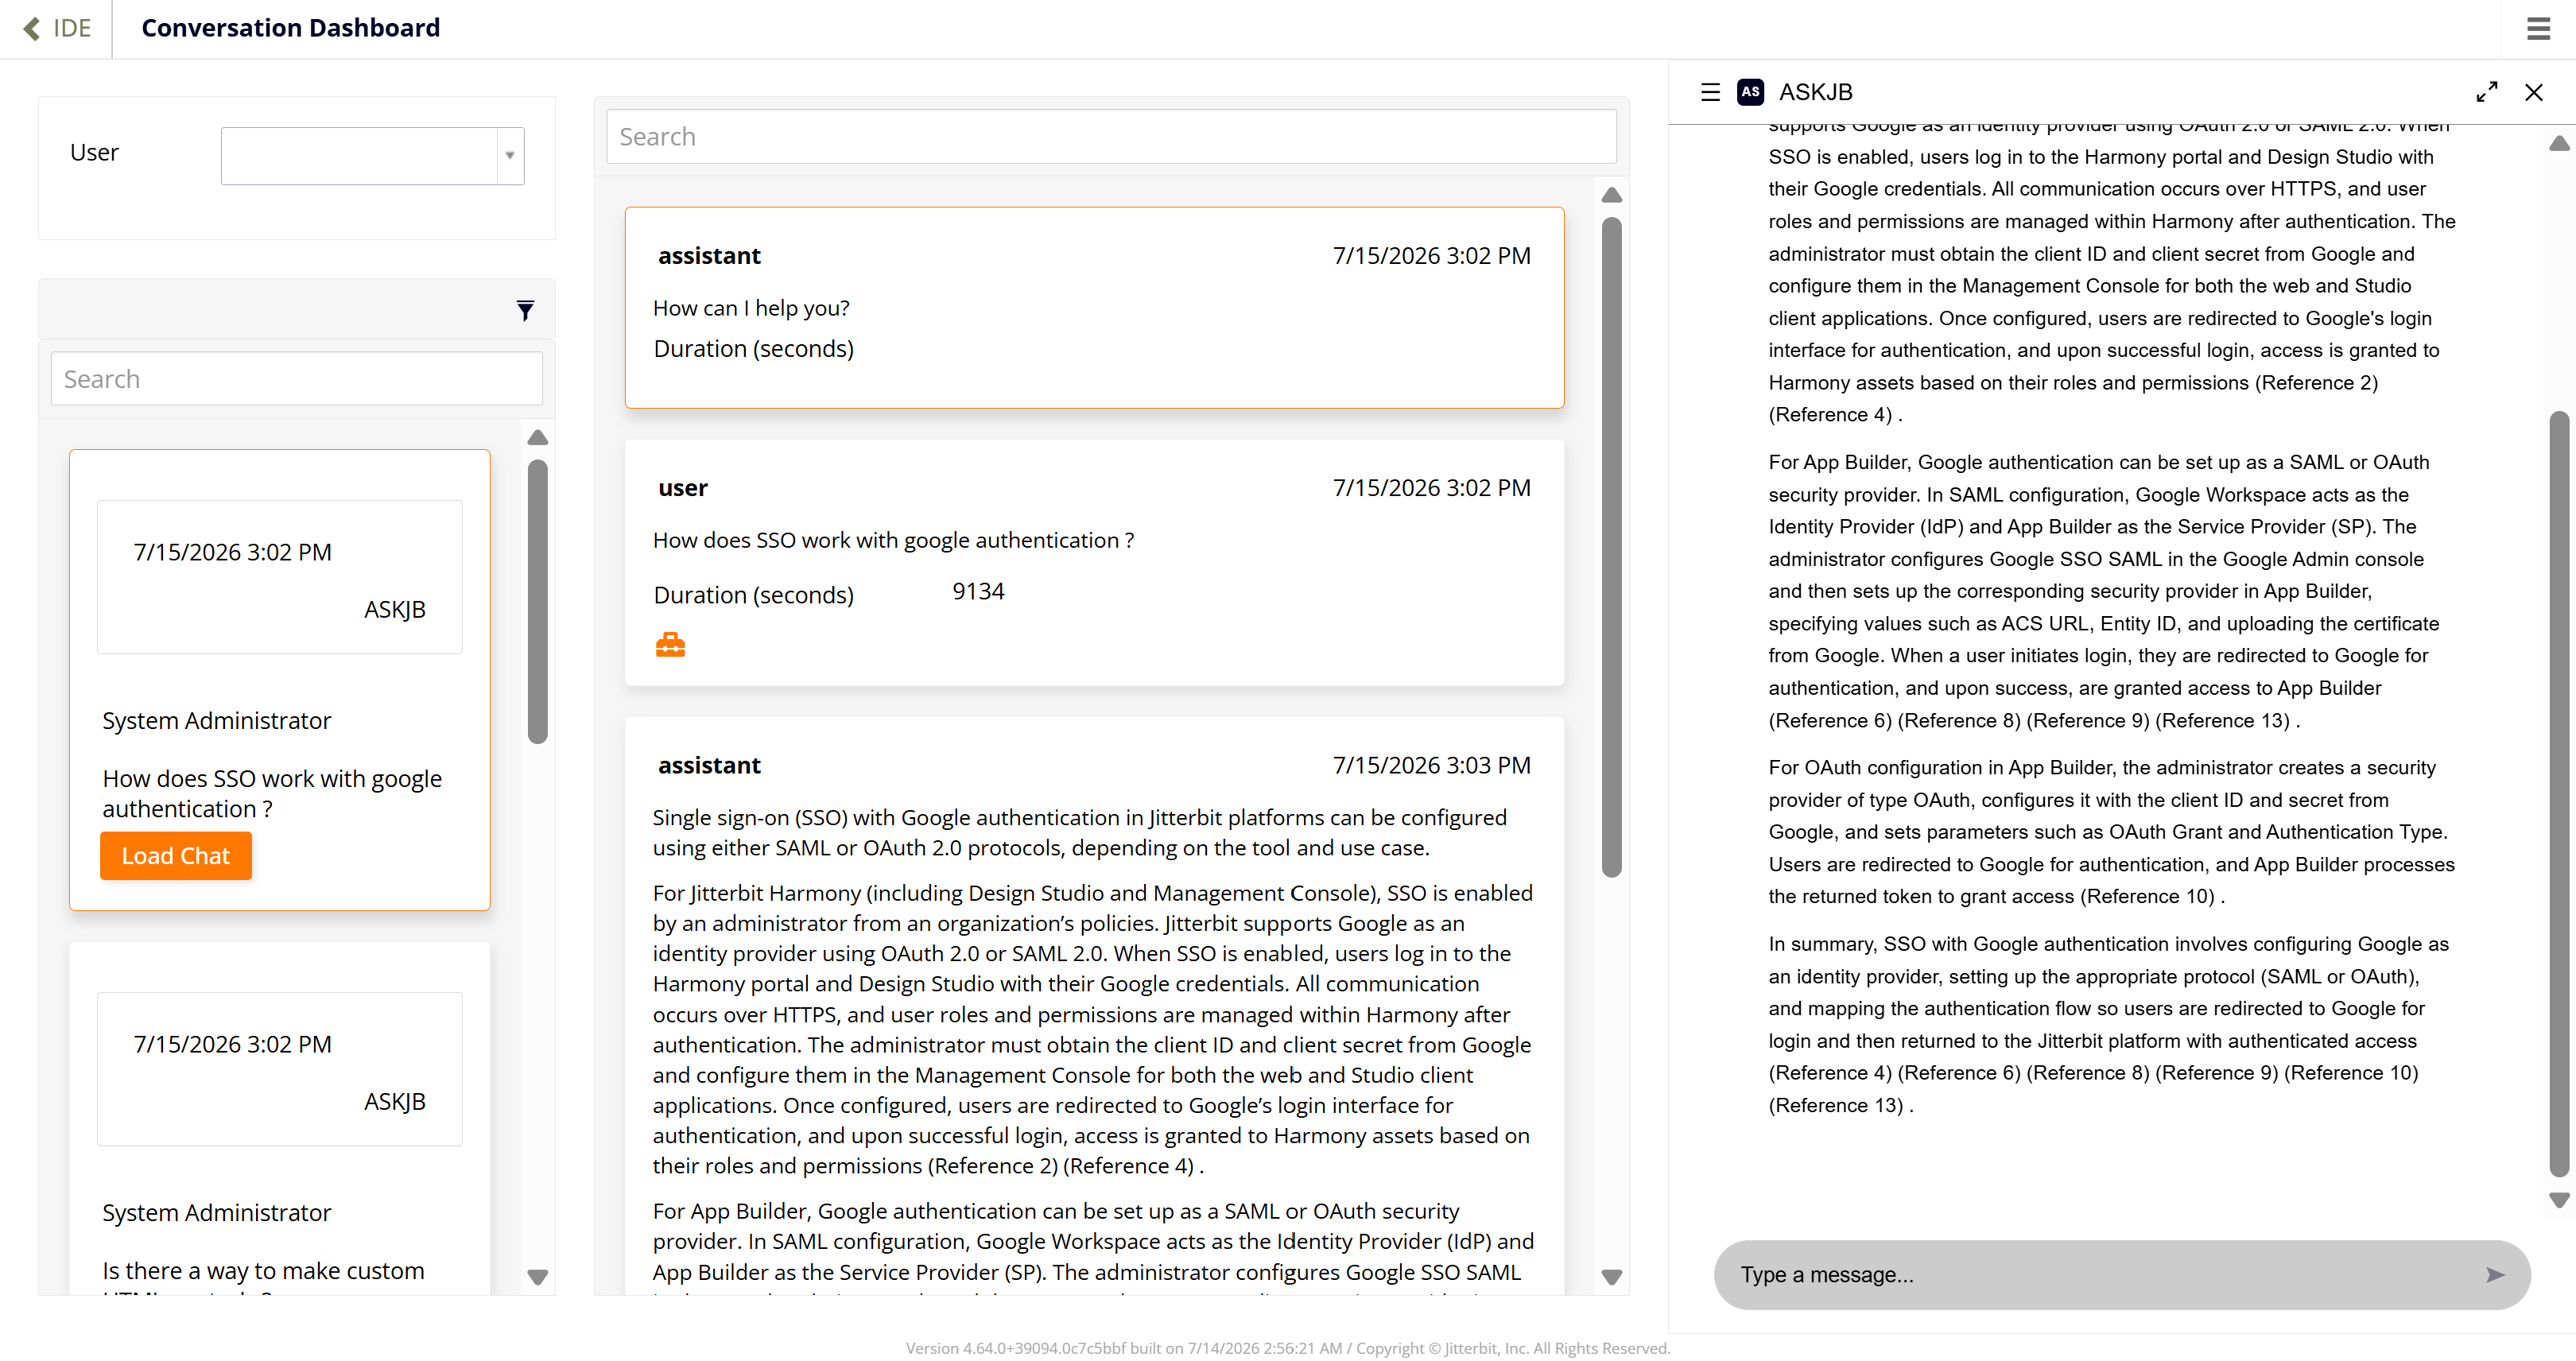
Click Load Chat on a conversation to load it into the chat interface, where you can review the full conversation and continue it by sending new messages:
View message debug details
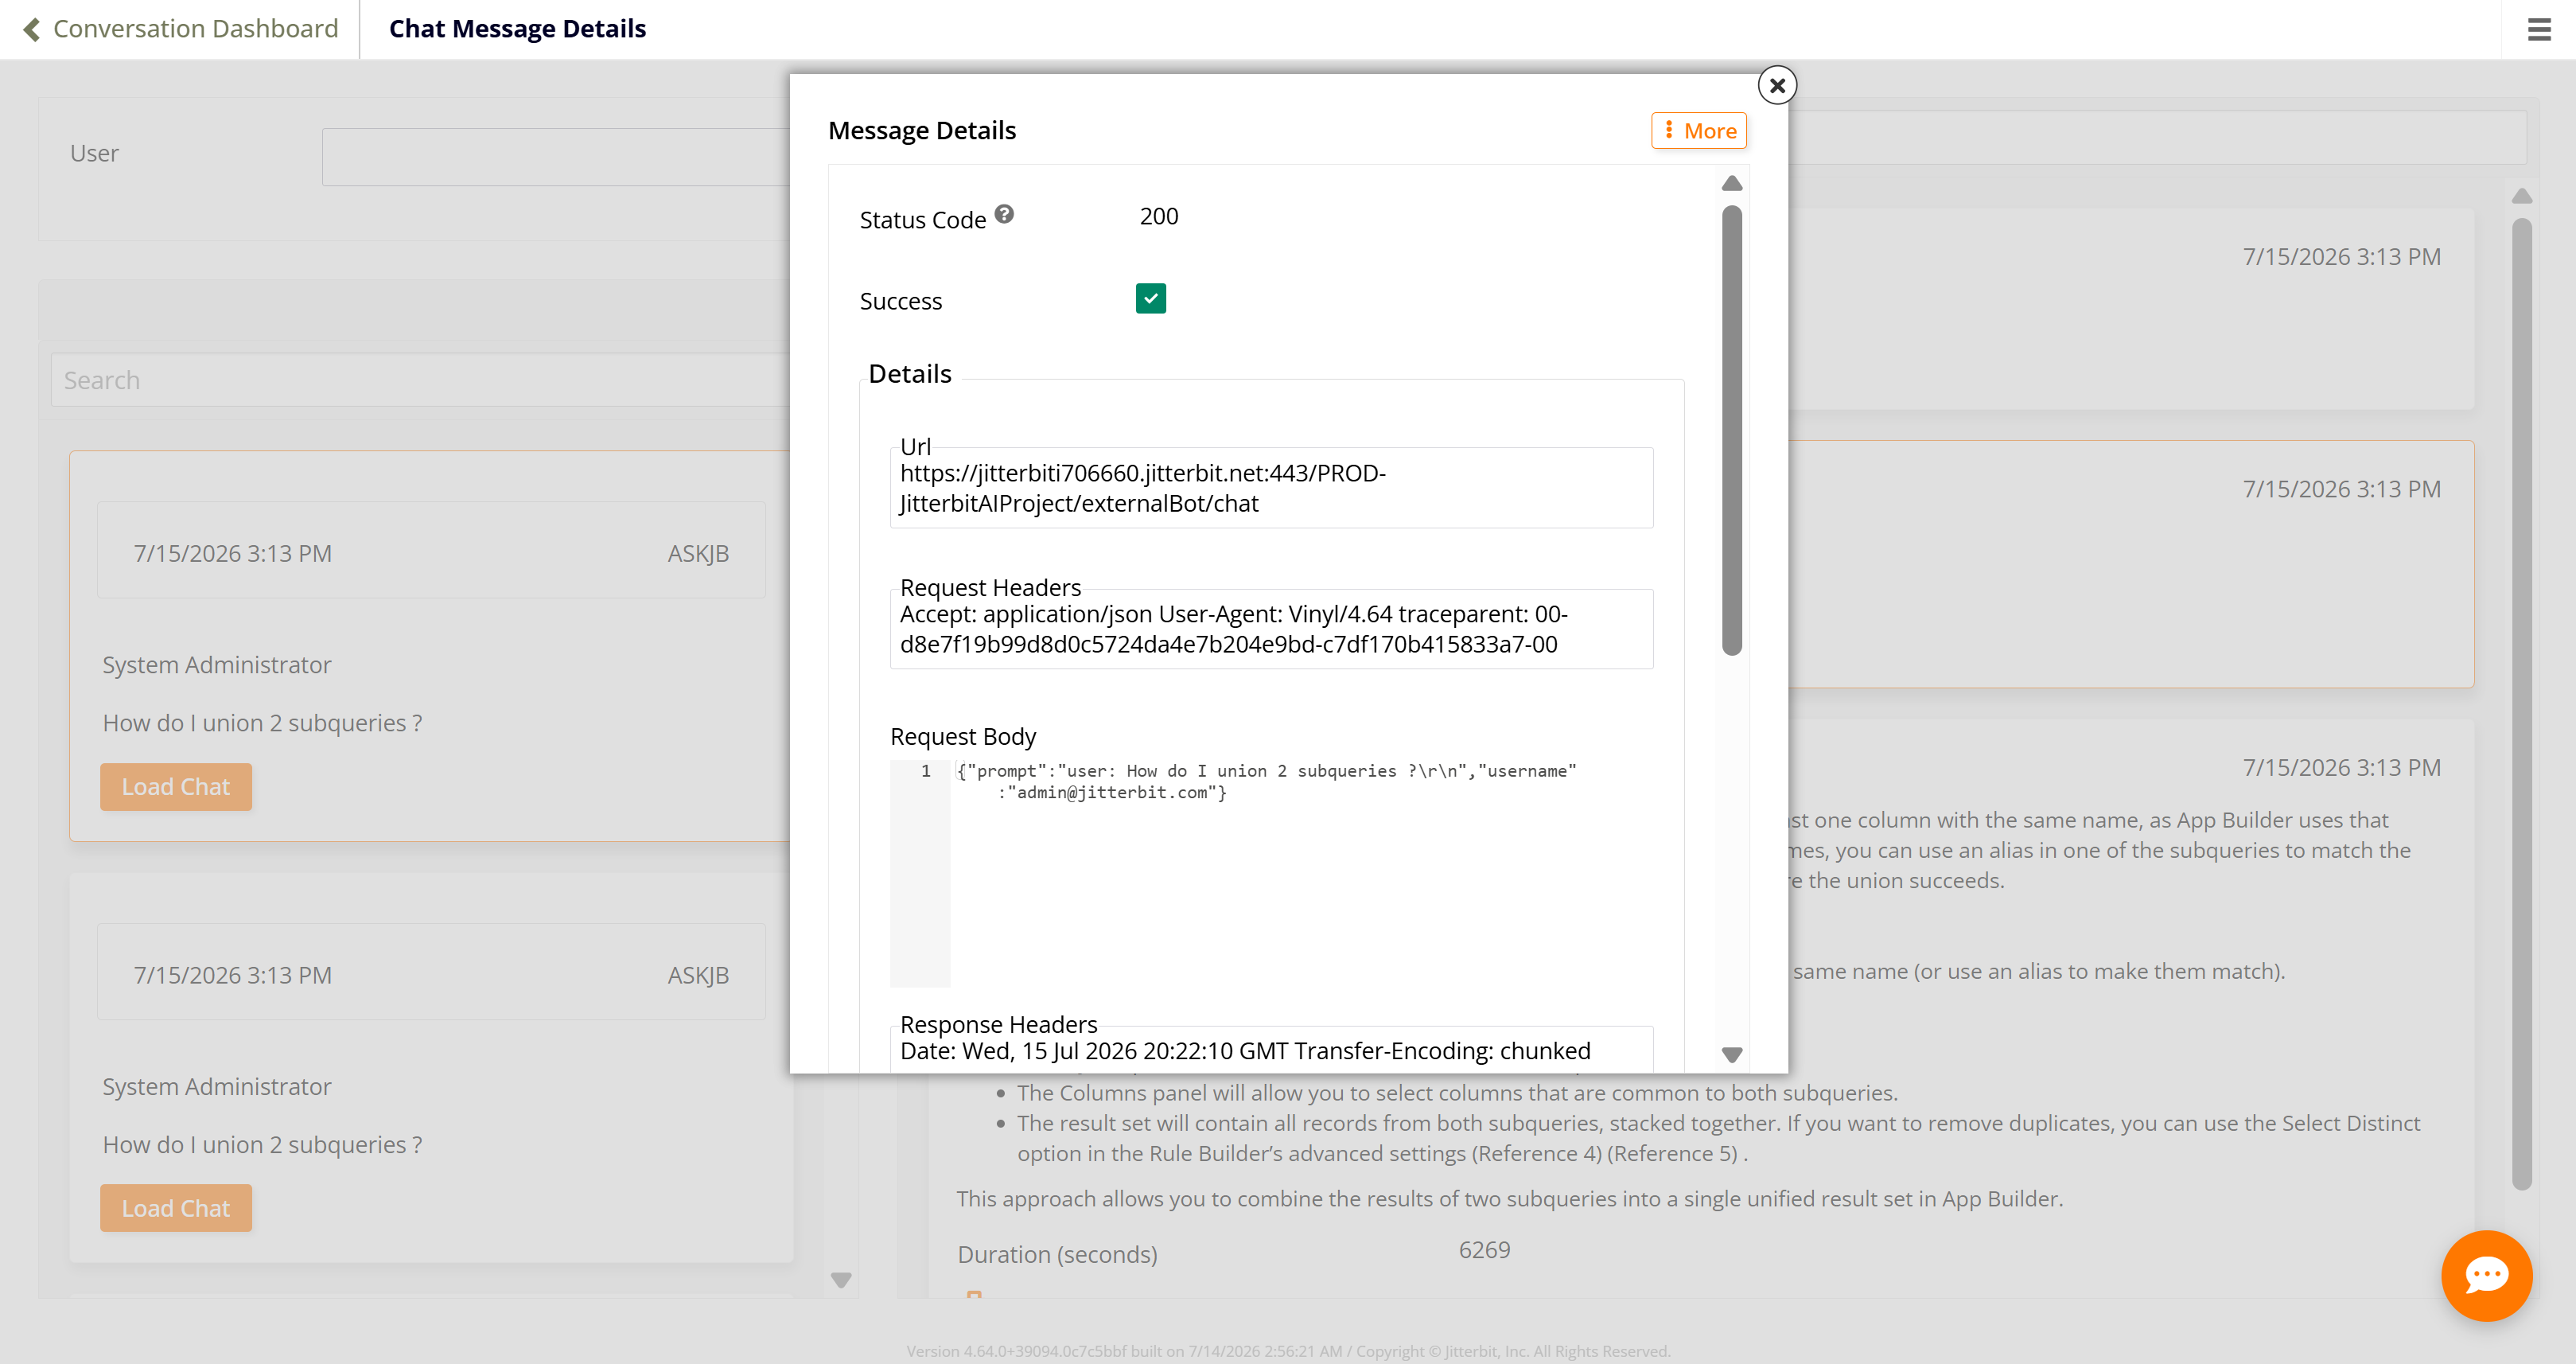
For messages from the AI agent, click the icon to open the Message Details dialog:
-
Status Code and Success: The HTTP status code returned by the agent's endpoint, and whether the request was successful.
-
Details section:
-
Url: The endpoint the request was sent to.
-
Request Headers and Request Body: The headers and body sent to the agent, including the user's prompt.
-
Response Headers and Response Body: The headers and body returned by the agent.
-
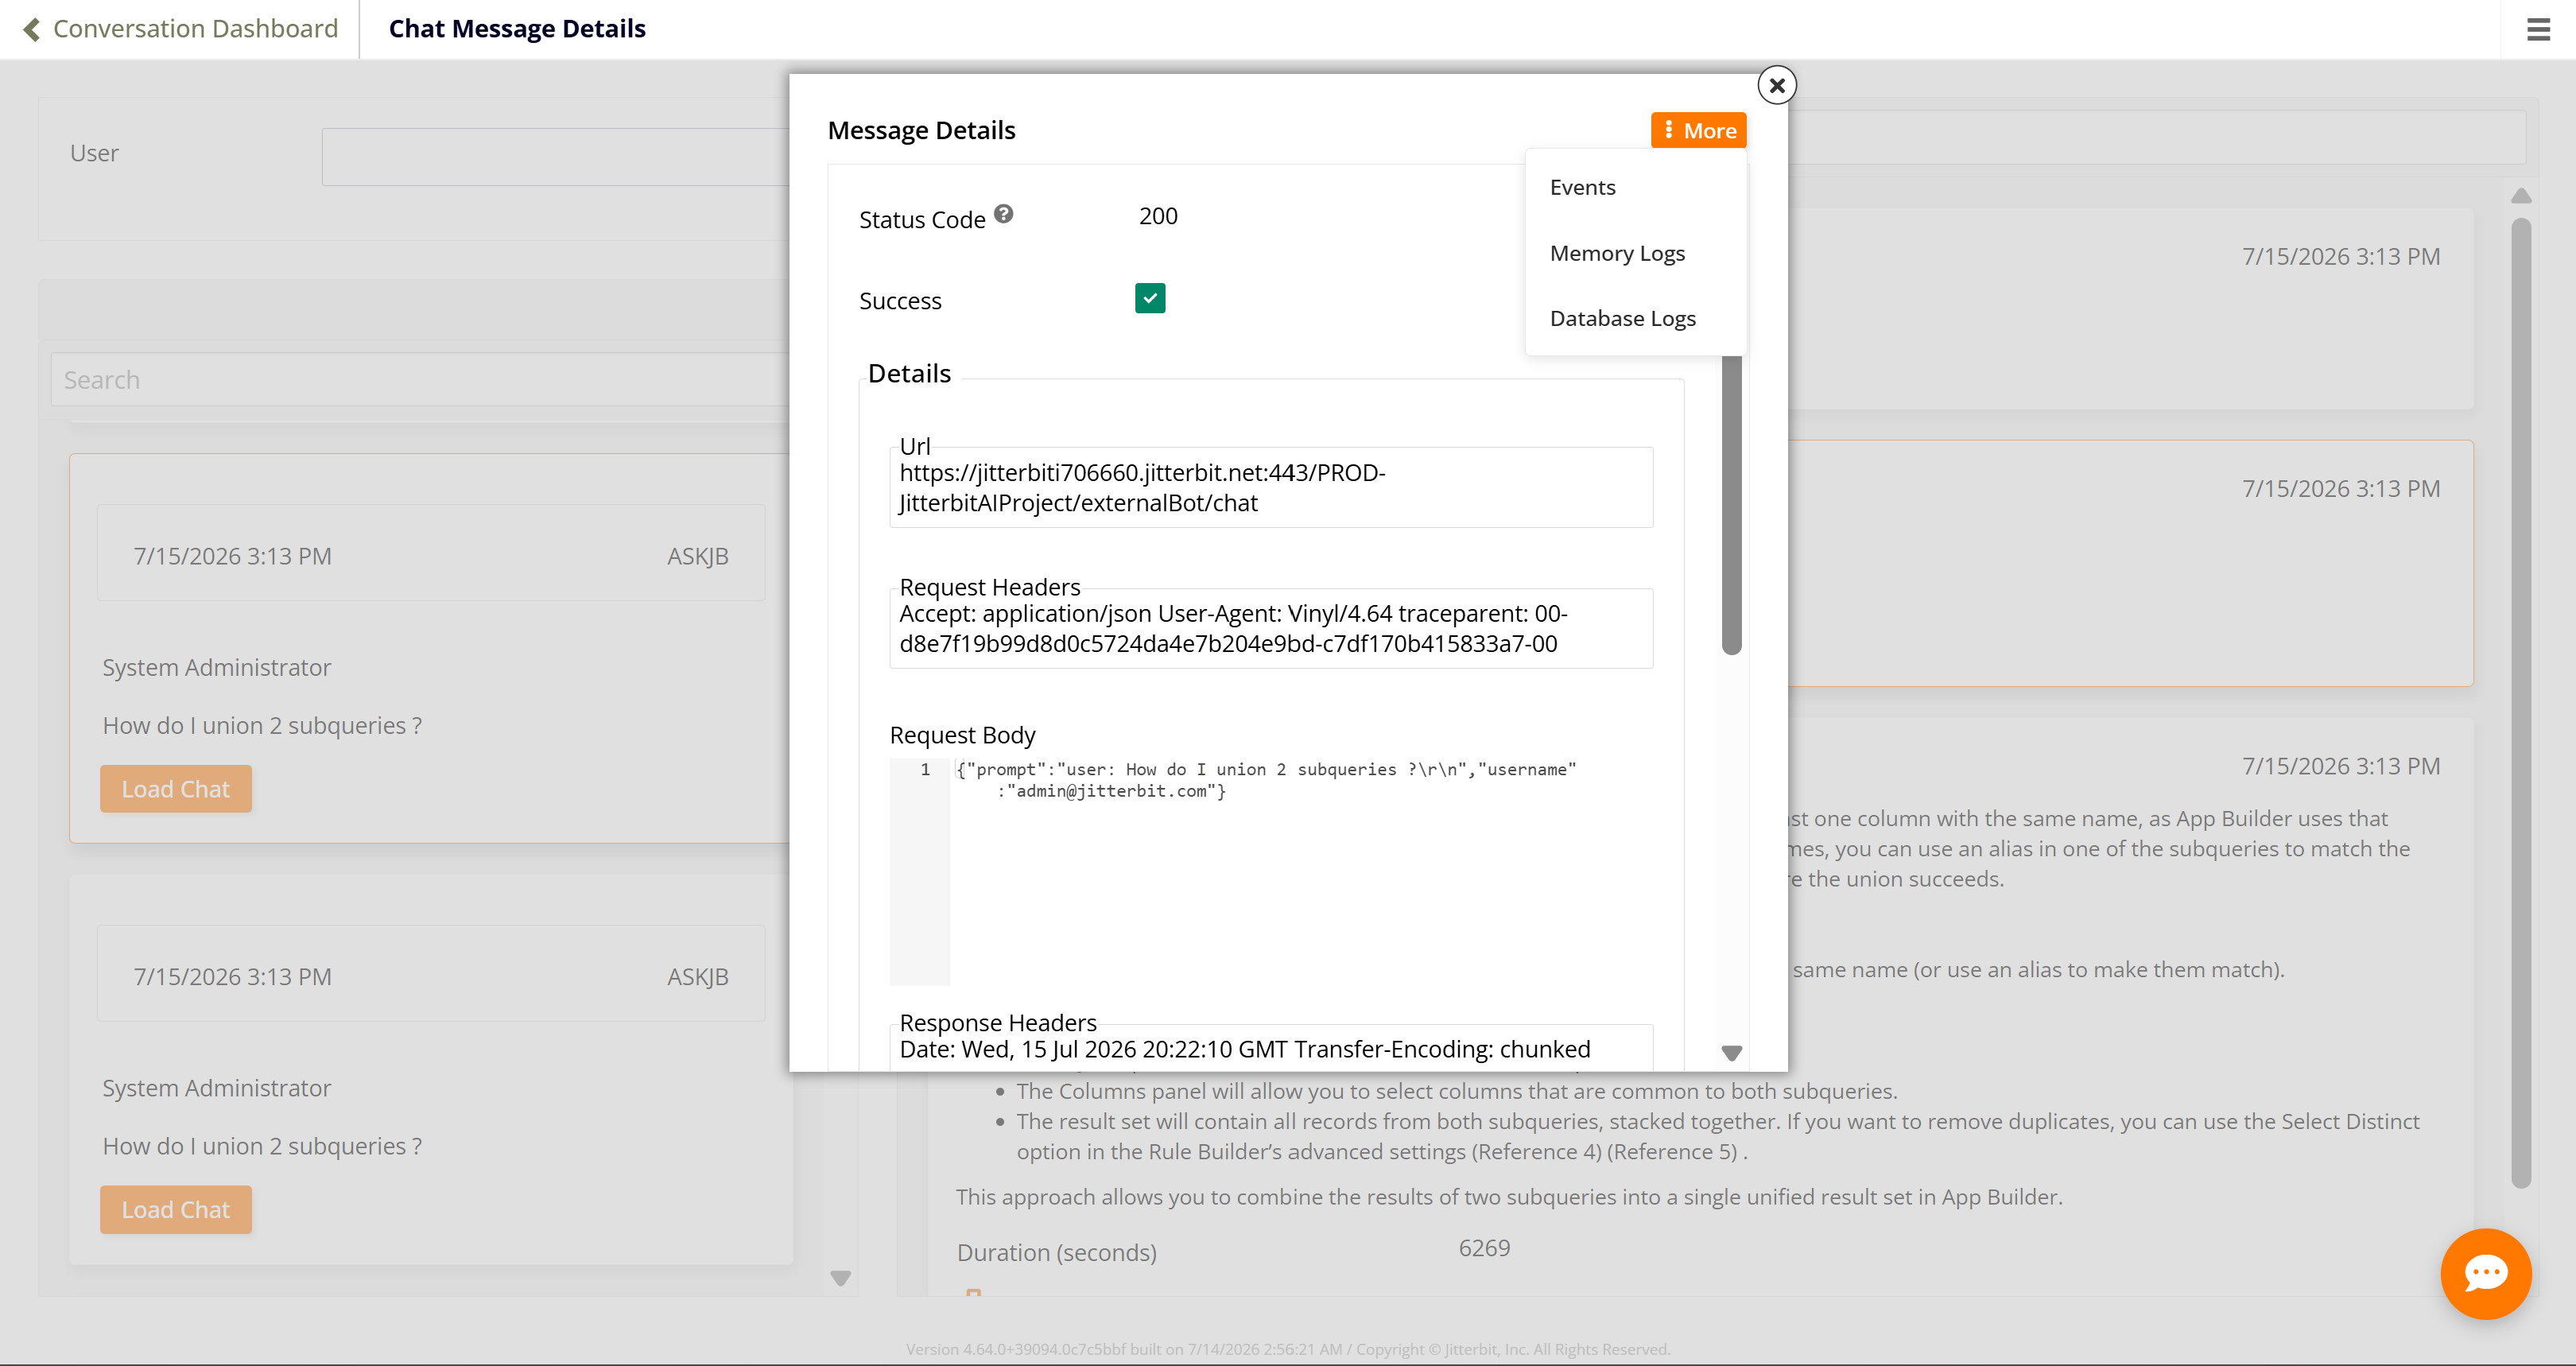
Click More for additional debug views:
-
Events: Events logged while processing the message.
-
Memory Logs: Memory usage while processing the message.
-
Database Logs: Database queries run while processing the message.