API Logs page (legacy) in Jitterbit API Manager
Introduction
The API Logs page within API Manager displays a table of all API processing logs and debug logs (if debug logging is enabled). Logs are generated for custom, OData, and proxy APIs when they are called through the cloud API gateway or private API gateway.
Legacy API Logs interface
This documentation is for the previous API Logs interface. The API Logs page has been updated with a new interface that is being rolled out gradually to organizations. If you see the updated interface in your organization, refer to the current API Logs documentation instead.
API calls generate four types of logs:
-
API logs: API Manager automatically generates API logs on the API Logs page for each API Manager API call. API logs contain information about the API call, including the timestamp of the API request, the HTTP status code, the request ID, the request method, the request URI, the response time, the source IP of the calling application, the source application, and any log messages.
-
API debug logs: Detailed trace information showing each step of request processing through an API Manager API's service URL. API debug logging is not enabled by default and must be enabled on an individual API Manager API. To enable debug logging, see the Settings tab in custom API configuration, OData API configuration, or proxy API configuration.
-
API verbose logs: Request and response payload data received or sent through an API Manager API's service URL. API verbose logging is not enabled by default and must be enabled on an individual API Manager API. To enable verbose logging, see the Settings tab in custom API configuration, OData API configuration, or proxy API configuration.
-
Private agent operation logs: Information about API calls written to the private agent's
jitterbit.logfile located in thelogdirectory. These logs contain the start of an API call and the time elapsed. Private agent operation logs are configured in the private agent configuration file.
Note
When an API triggers a Studio operation, the operation logs appear in the Studio operation log view and the Management Console Runtime page, not on the API Manager API Logs page. For details on what appears in operation logs for API-triggered operations, see API request and response data.
Harmony retains logging data for API logs, debug logs, and verbose logs for 30 days from the date the API is consumed.
To add additional log information for OData APIs, including SQL data sent to the database, edit the private agent configuration file and set DebugJDML to true.
Access the API Logs page
To access the API Logs page, use the Harmony portal menu to select API Manager > API Logs.
API Logs page header
The header along the top of the API Logs page includes a search bar, filters, and additional options:
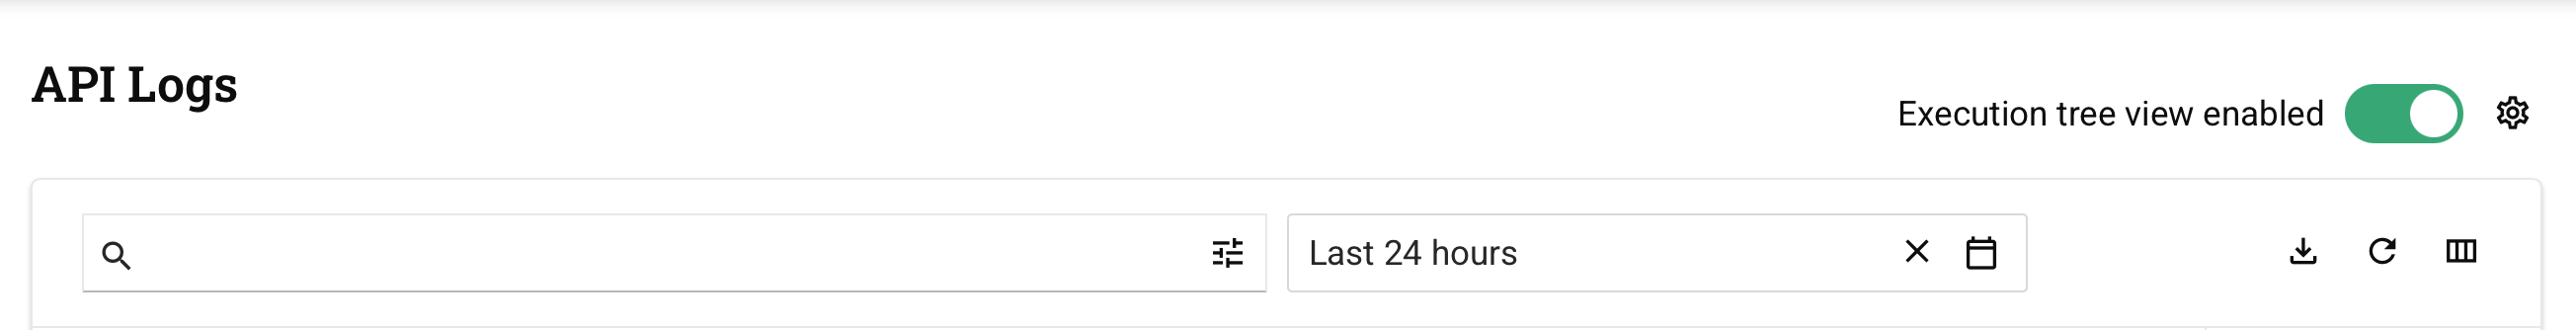
You can adjust the data displayed by using the Filter by and View Data dropdowns.
Filter by
The Filter by dropdowns allow you to display API logs based on specific criteria across any combination of environments, APIs, profiles, status codes, or request methods.
Note
The API Logs page remembers your last-used filter selections. If you're not seeing expected results, confirm that previously applied filters have been cleared.
Each filter displays a dropdown list of criteria from which you can select one or multiple criteria.
These are the available criteria to filter by:
-
Environments: Use the dropdown to select environments where the APIs are located. When all filters are unselected, environments for all APIs in the organization to which you have access are displayed.
-
APIs: Use the dropdown to select published APIs within the organization. When all filters are unselected, all APIs in the organization to which you have access are displayed.
Note
Previously published APIs that become unpublished will not appear in the APIs dropdown. API logs for these APIs will be present on the API Logs page, but cannot be filtered.
-
Profiles: Use the dropdown to select the assigned security profiles of the APIs. When all filters are unselected, all security profiles in the organization to which you have access are displayed.
-
Status Codes: Use the dropdown to select the HTTP response status code groups, selecting from Success (2xx), Redirections (3xx), Client Errors (4xx), and Server Errors (5xx). When all filters are unselected, all HTTP response status codes for APIs in the organizations to which you have access are displayed. For more information on status codes, see w3.org status code definitions.
-
Request Methods: Use the dropdown to select the HTTP request methods, selecting from GET, PUT, POST, DELETE, PATCH, and MERGE. When all filters are unselected, all HTTP request methods for APIs in the organization to which you have access are displayed. For more information on HTTP request methods, see w3.org request methods.
-
API Gateway: Visible only when an organization uses two or more cloud API gateways. Use the menu to select the cloud API gateway domain. The API Logs table will display logs only for the selected domain.
View Data
The View Data option allows you to display logs within a specific period of time. The default setting for the period of time is Last 7 Days.
Use the View Data dropdown to select the desired period of time. Select one of Last 10 Minutes, Last 1 Hour, Last 10 Hours, Last 24 Hours, Last 7 Days, Last 1 Month, or Custom Period.
Selecting Custom Period allows you to display API logs within a specified time period within the past 30 days. When this option is selected, additional From and To calendar fields display:

- From: Click to adjust the starting date and time for the API logs.
- To: Click to adjust the ending date and time for the API logs.
After clicking the From or To calendar fields, a calendar dialog is displayed where you select the date and time.
Search
The search bar allows you to filter the logs by the search criteria provided below:

- Only Logs with Messages: Select to further restrict search results only to logs that include logging details. The search results will automatically refresh.
Search criteria
These are the search criteria that can be used. Examples of valid and invalid search criteria are included:
| Criterion | Valid Search | Invalid Search |
|---|---|---|
| Request ID | requestid=123%;requestid=fI9KRyjM%; |
requestid!=123%; |
| Request URI | requesturi=%acme2.jitterbit.net%;requesturi=%jitterbit.net/defaultUrlPrefix/test;requesturi=%[environment]/[version]/test;requesturi=%[environment]/[version]/test% |
requesturi!=%acme2.jitterbit.net%; |
| Response Time | responsetime>5;responsetime<5;responsetime>=5;responsetime<=5;responsetime=0; |
responsetime!=5; |
| Source IP | sourceip=14.141%; |
sourceip!=14.141%; |
| Source Application | sourceapp=Mozilla%;sourceapp=%Chrome%; |
sourceapp!=Mozilla%; |
| Message | message=%REJECT%;message=%Access Denied%;message=%Ran successfully!%; |
message!=%REJECT%; |
Combine searches
Searches can contain a combination of criteria. Combined search criteria must be separated by a semicolon (;) between each criterion. These are examples of valid combined searches:
message=%Access Denied%;requesturi=%contacts%;
requestid=%yzaccwui%;message=%REJECT%;
requesturi=%contacts%;responsetime<=2;
responsetime>=5;sourceapp=%Chrome%;
responsetime>=5;sourceip=70.5%;
sourceapp=%Chrome%;message=%REJECT%;
sourceapp=%Mozilla%;responsetime<=1;
sourceip=70.5%;requesturi=%contacts%;
Additional options
Additional API log options display on the left side of the page directly above the search bar:

-
View last refreshed: Displays the last time the data was refreshed either dynamically or manually. The time is displayed in the format
h:mm:ss. -
Refresh: Click to refresh the log data based on the applied filters and search criteria.
-
Download as CSV: Click to download the current log data based on the applied filters and search criteria.
Note
The date field within the CSV file is a UNIX timestamp that will require conversion if you want to use a different date and time format.
View API logs
Each row in the API Logs table displays API logging data for an API call:
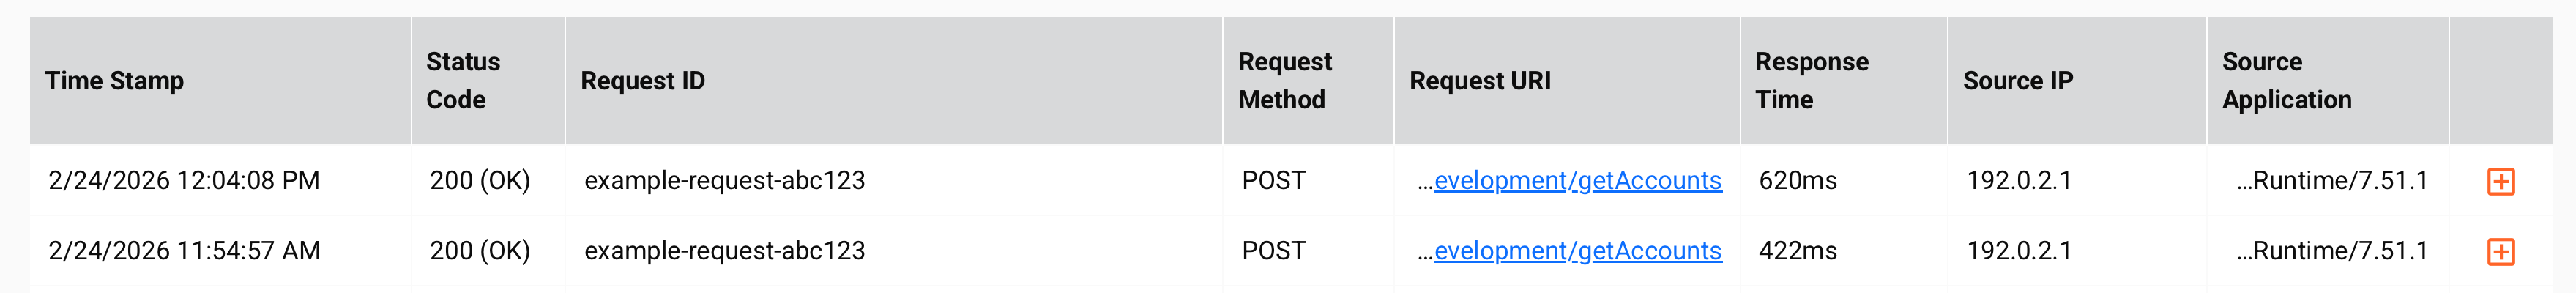
- Time Stamp: The timestamp of the API request. Times are displayed in your browser's time zone.
- Status Code: The HTTP status code. For more information on HTTP status codes, see w3.org status code definitions.
- Request ID: A unique ID for the API request.
- Request Method: The API's HTTP request method (GET, PUT, POST, DELETE, PATCH, or MERGE).
- Request URI: The full URL of the API that was called. Hover over the Request URI field to view the full URL.
- Response Time: The amount of time, in milliseconds, that the API took to execute.
- Source IP: The external IP address of the application or server that called the API.
- Source Application: The source application for the API call, present only when the API call is being passed in a request header. Hover over the Source Application column to view the contents of the field.
Each page displays 20 logs. You can view all the logs within the filter and search criteria using the Next and Previous buttons.
View log details
To view additional log details or debug logs (if enabled), click the expand icon on a log entry:
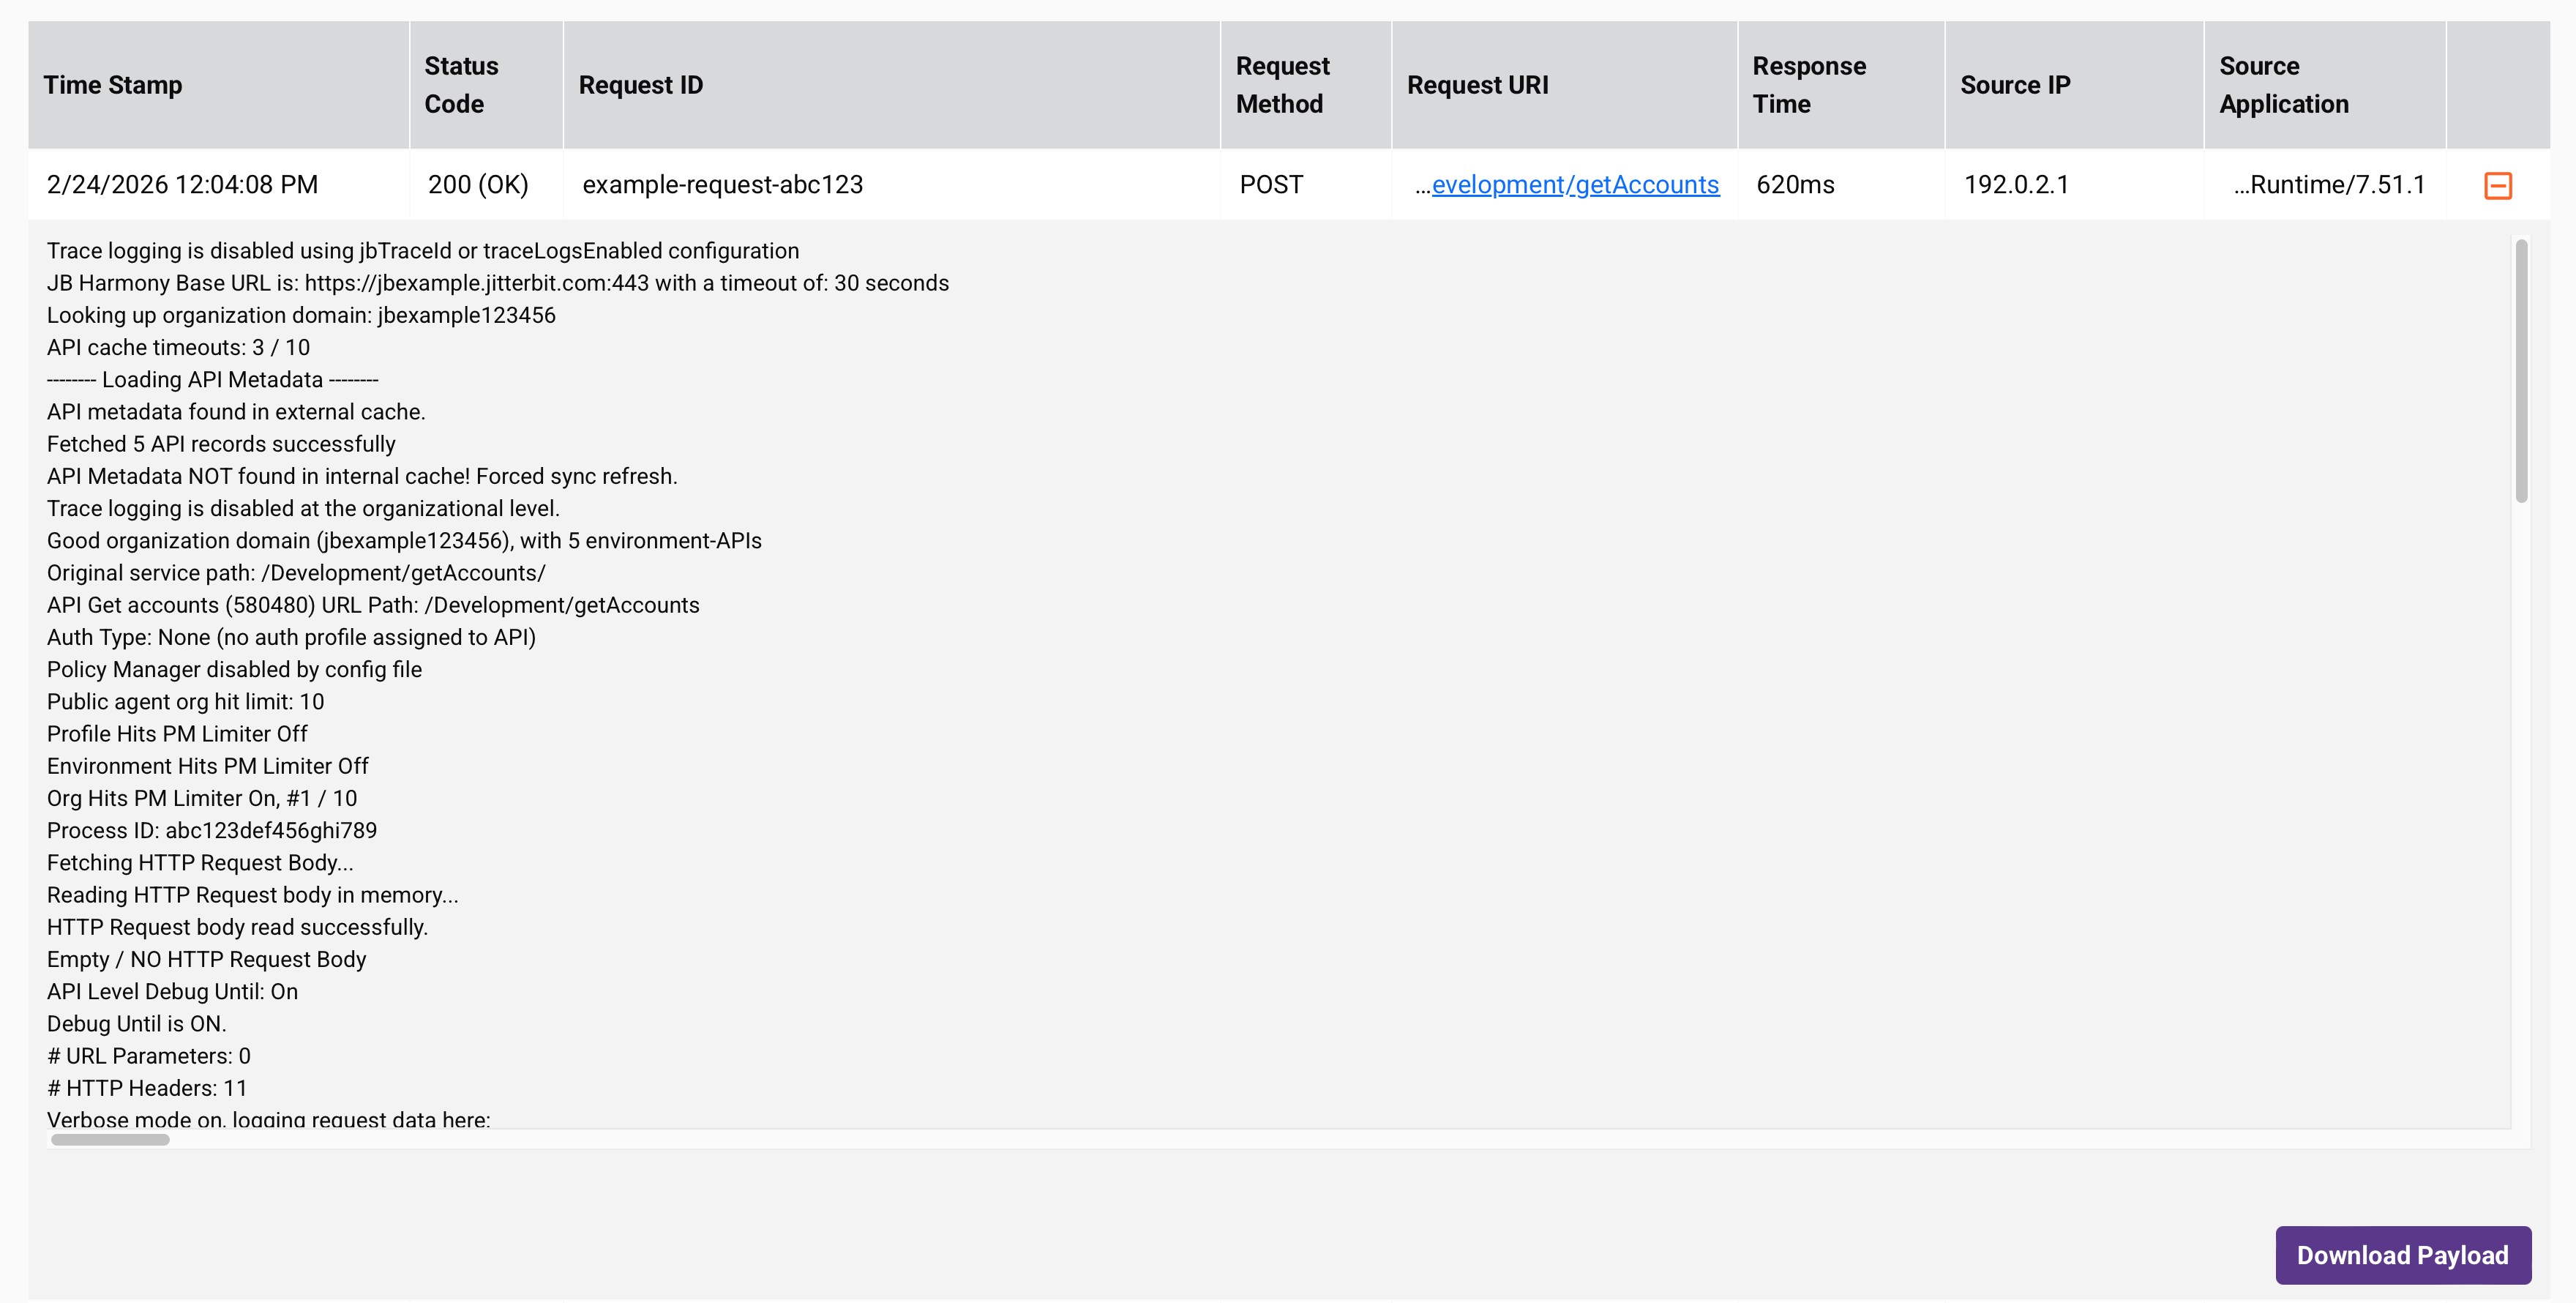
A typical API log will contain these details:
- Harmony region domain name, service path, and base URL (see API service URL)
- API call processing time
- Security profile information such as authorization type and credentials used
- Payload details including length of the payload and the response size
- Error information (if applicable)
- Debug logs (if enabled)
- Verbose logs (if enabled)
When debug logging is enabled for an API and the API payload contains more than 10,000 characters, a Download Payload button is visible for the log entry. When clicked, a ZIP file of the API payload is downloaded to your local machine.
API Manager Log Service API (Beta)
As an alternative to downloading an API log file by clicking Download as CSV, you can retrieve API logs programmatically using the API Manager Log Service API (Beta).